Enabling Observability
EC2
Step 1 - Default Metrics
By default, AWS provides basic monitoring. It includes CPU, Network, Disk and Status Check metrics which are collected at every 5-minute interval. Detailed monitoring can be enabled to get metrics for every 1-minute interval.
Step 2 - Enable Custom Metrics
By enabling custom metrics, system can get more metrics than the default metrics of EC2. Steps as follows.
Step 3 - Assign IAM role to EC2 instances
-
Download the CloudFormation template and upload it in the AWS CloudFormation console to create the CloudCADIEC2CustomMetricsRole IAM role. Once the stack is created, copy the EC2CustomMetricsRoleArn from its Outputs tab and follow the steps below based on that ARN.
-
Go to EC2 console -> Instances.
NoteFor collecting the custom metrics data for the EC2, we need to assign the role to EC2 instance to push metrics to CloudWatch.
-
Select the instance which you want to enable memory metrics.
-
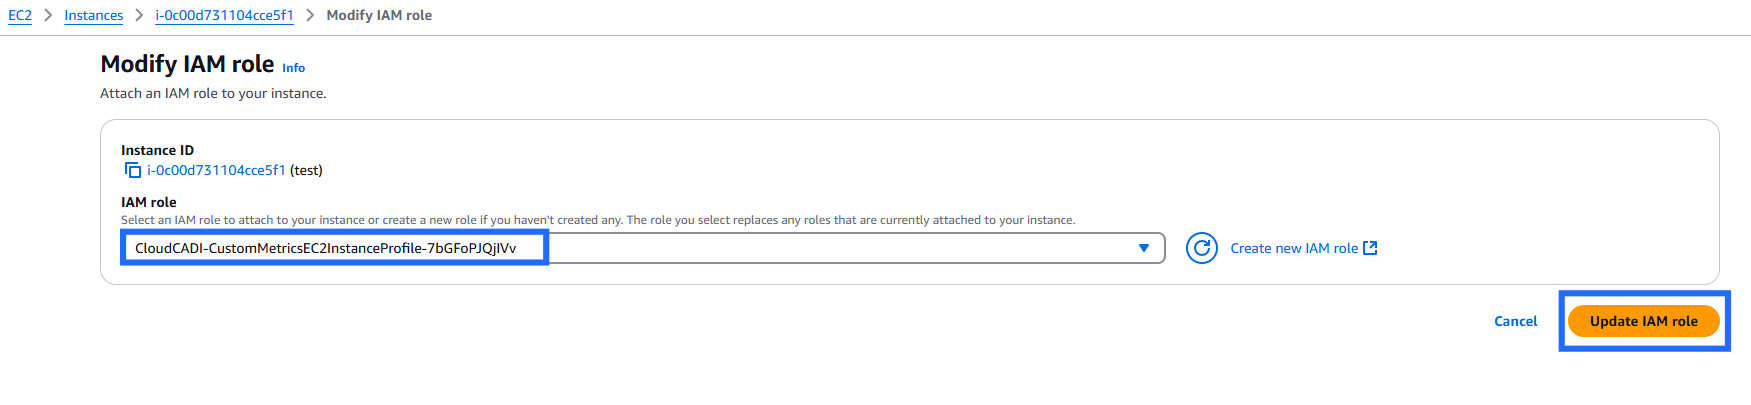
Actions -> Security -> Modify IAM role.

-
Search for the role name (the last segment of the ARN you copied,
CloudCADIEC2CustomMetricsRole_<AccountId>) and select the role. -
If the instance is already attached with any role, then you have to add the below policies to the existing role.
a. CloudWatchAgentServerPolicyb. AmazonSSMManagedInstanceCore -
Click Update IAM role.
Step 4 - Create Parameter to Store Common Configurations
One policy enables CloudWatch agent to be installed on a server and send metrics to CloudWatch. The other policy is needed to store CloudWatch agent configuration in Systems Manager Parameter Store. Parameter Store enables multiple servers to use one CloudWatch agent configuration.
-
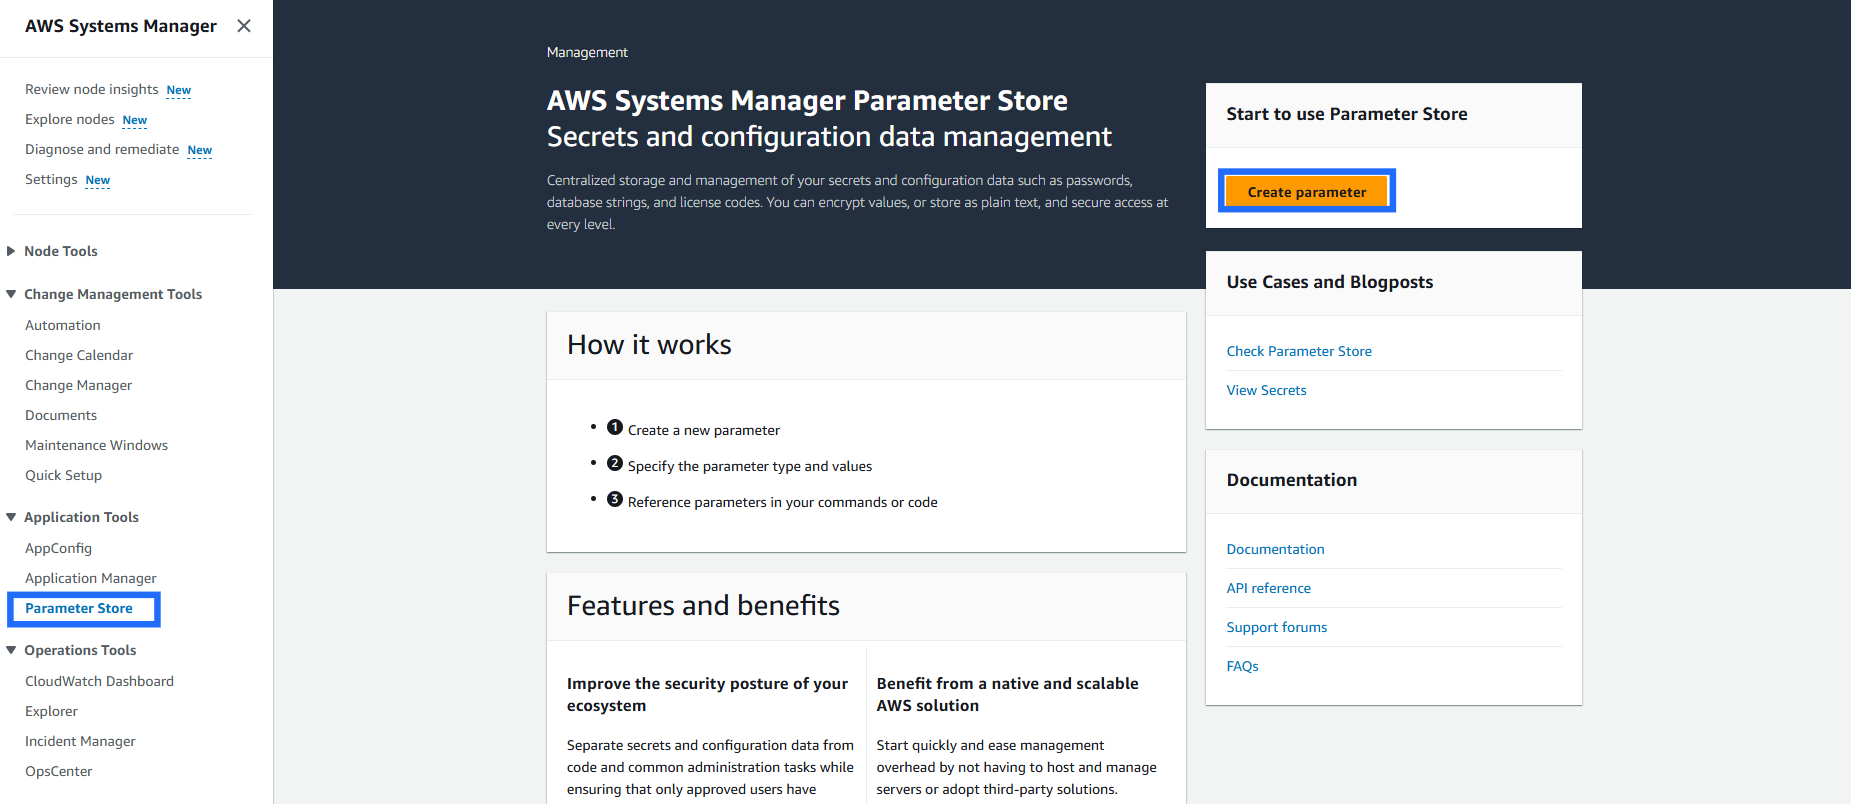
Go to Systems Manager console -> Parameter Store -> Create parameter.
-
Enter the parameter as given below and Click Create Parameter.
For Linux
Name : CloudCADI-EC2-Custom-Metrics-LinuxTier : StandardType : StringData type : textValue:{"metrics": {"namespace": "Custom","append_dimensions": {"InstanceId": "${aws:InstanceId}"},"metrics_collected": {"mem": {"measurement": [{"name": "mem_used_percent","rename": "memory_used_percent"}],"metrics_collection_interval": 60}}}}For Windows
Name : CloudCADI-EC2-Custom-Metrics-WindowsTier : StandardType : StringData type : textValue:{"metrics": {"namespace": "Custom","append_dimensions": {"InstanceId": "${aws:InstanceId}"},"metrics_collected": {"Memory": {"measurement": [{"name": "% Committed Bytes In Use","rename": "memory_used_percent"}],"metrics_collection_interval": 60}}}}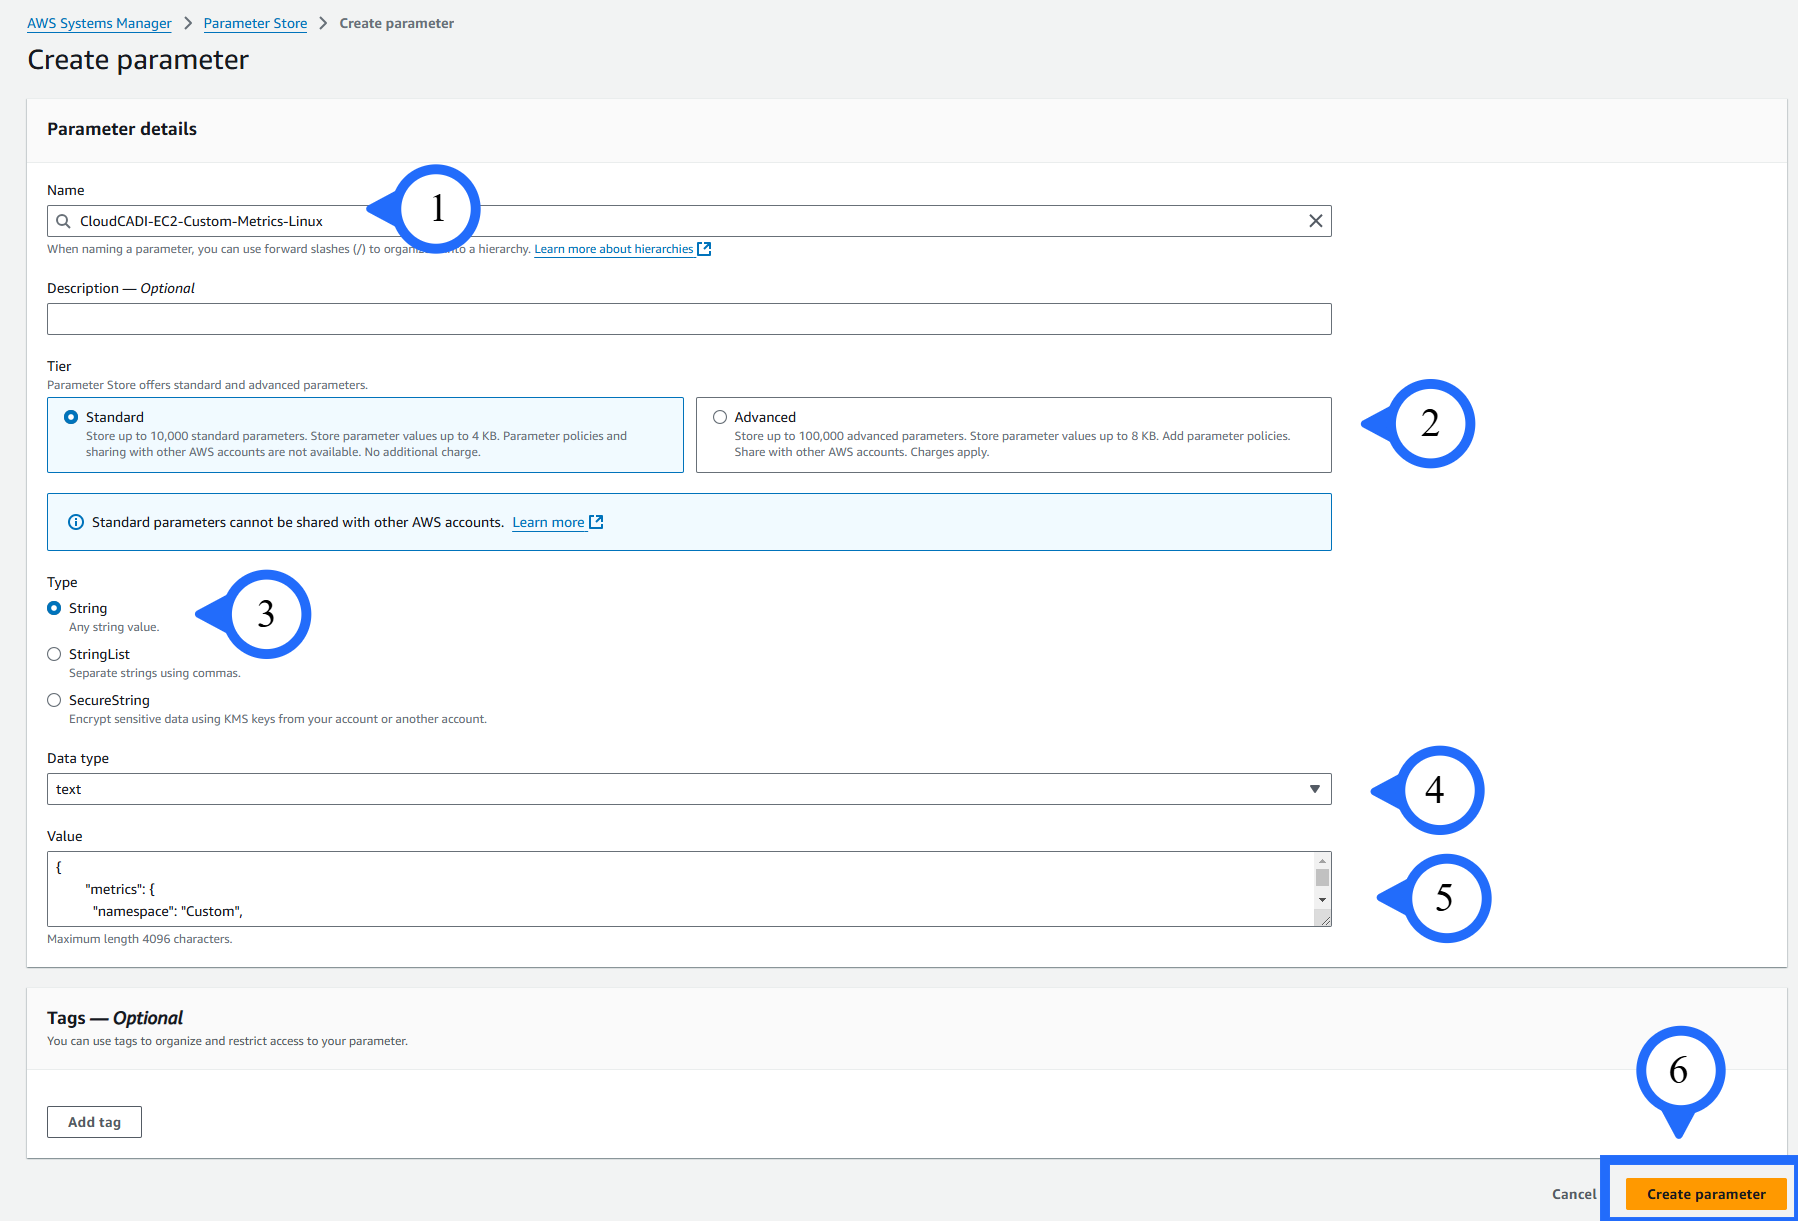
Step 5. To Install AmazonCloudWatchAgent
Once EC2 is assigned with proper IAM role, wait for 20-30 minutes then go ahead to run a command.
-
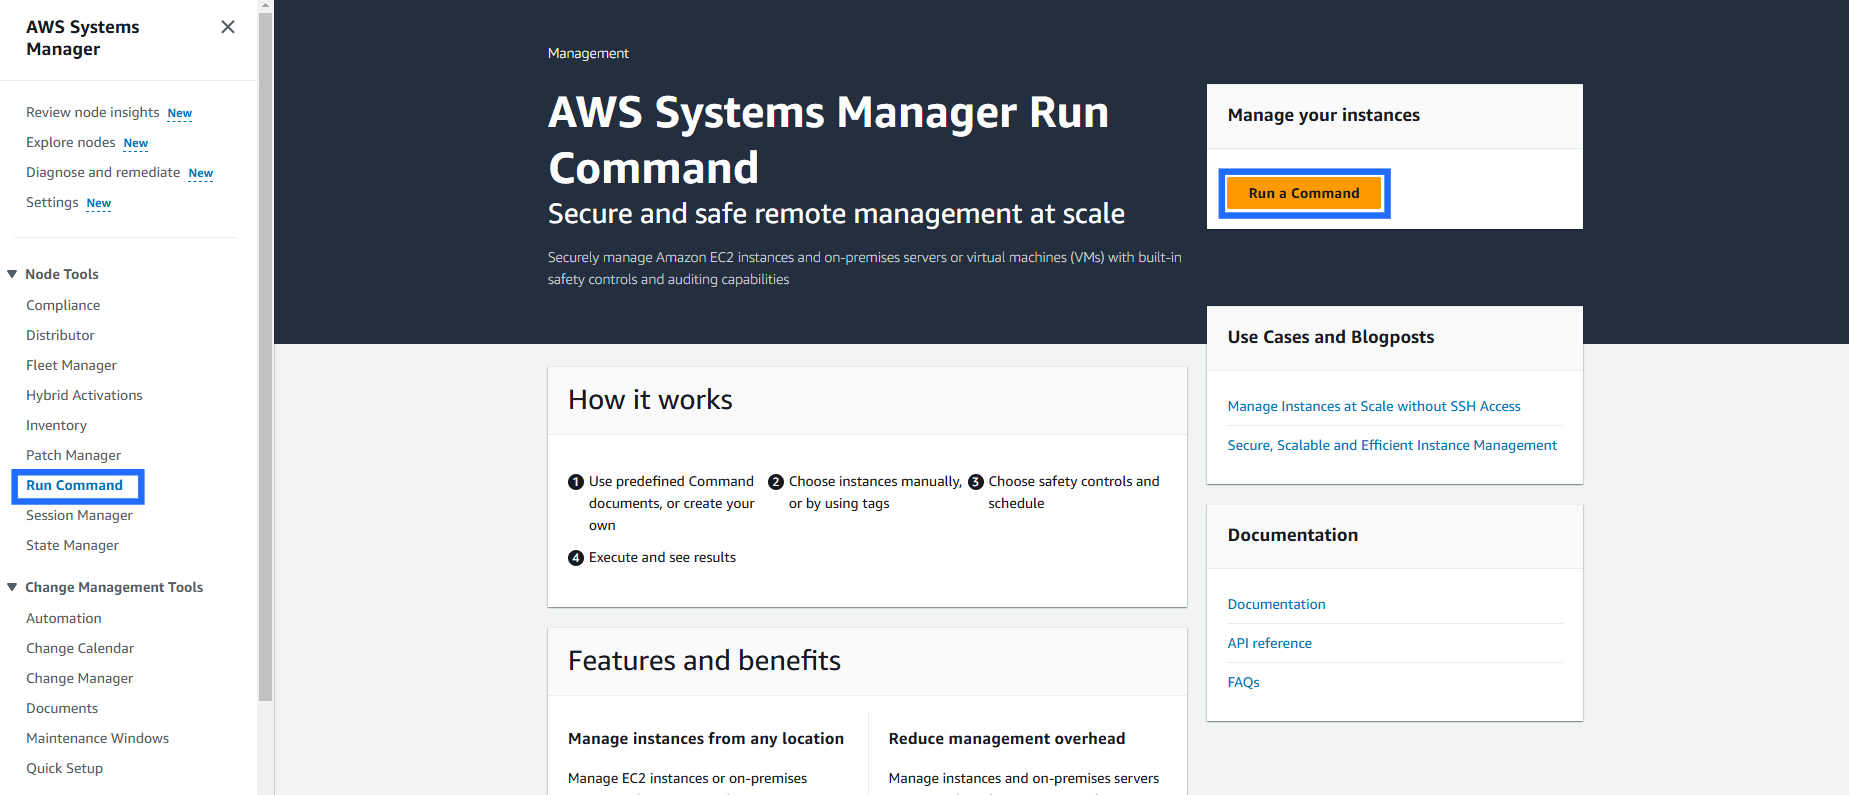
Go to Systems Manager console -> Run command -> Run a command.
-
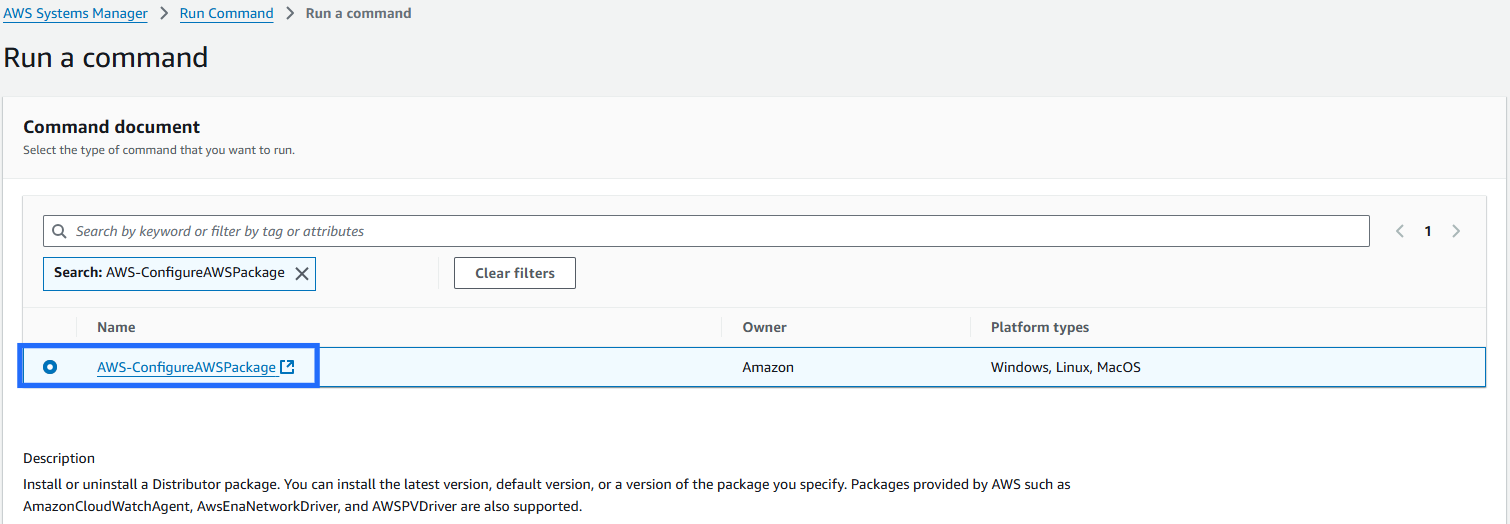
In Command document Search "AWS-ConfigureAWSPackage" from the command list and select.
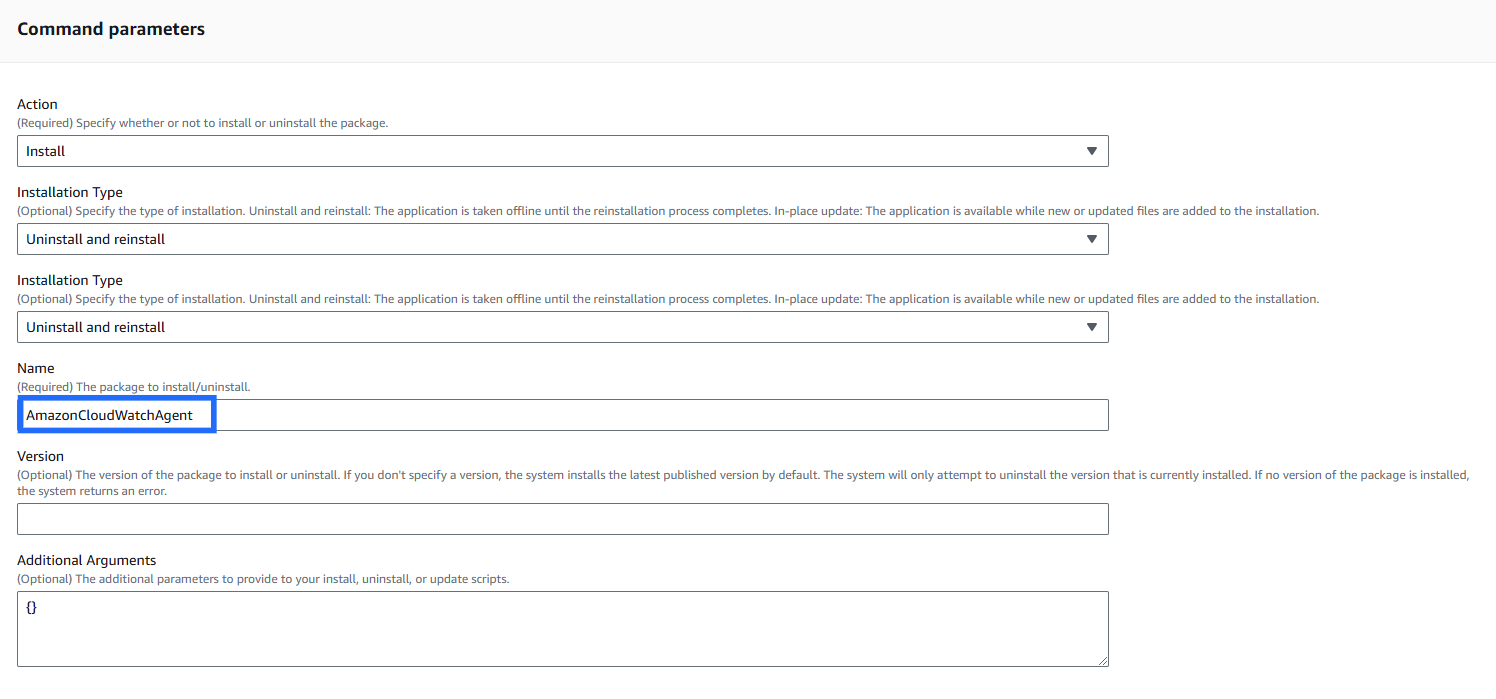
Command paramters
-
Name: AmazonCloudWatchAgent
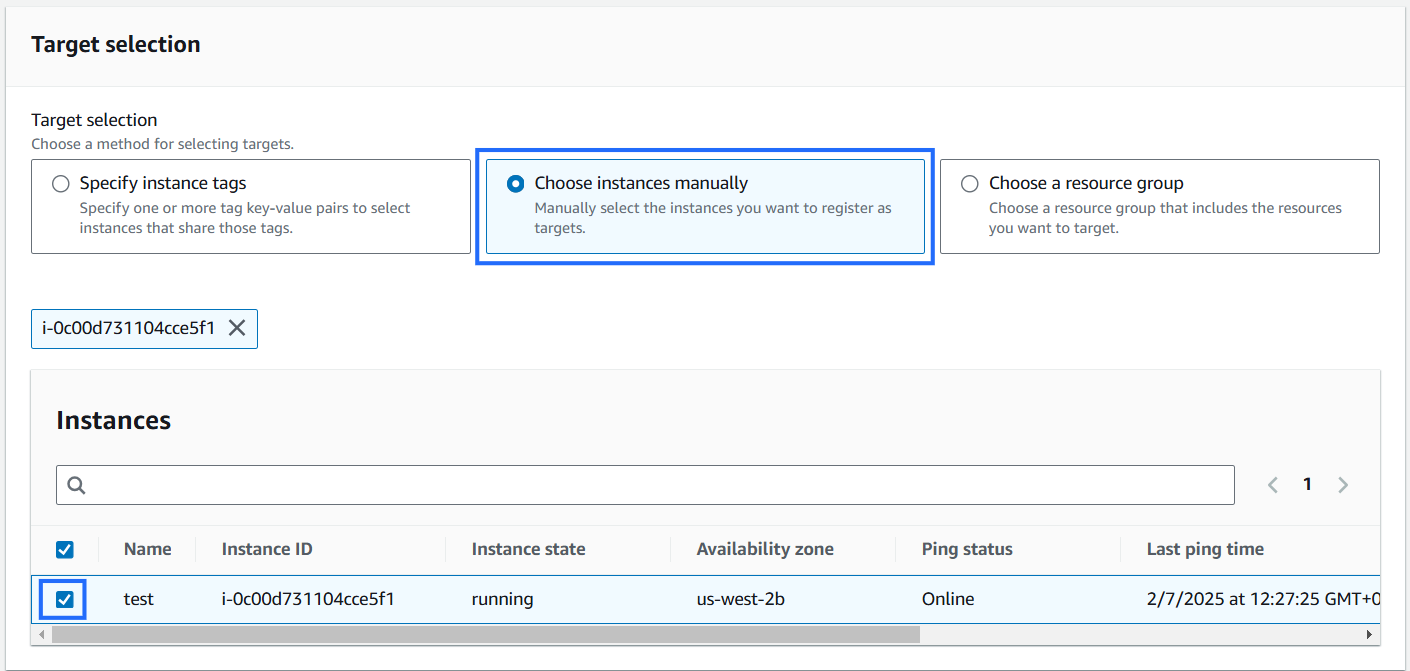
Target selection
-
Target selection: Choose instances manually.
-
Select the instances where the AmazonCloudWatchAgent to be installed.
Output options
-
Specify the S3 bucket if the command output to be stored if not disable and click Run.
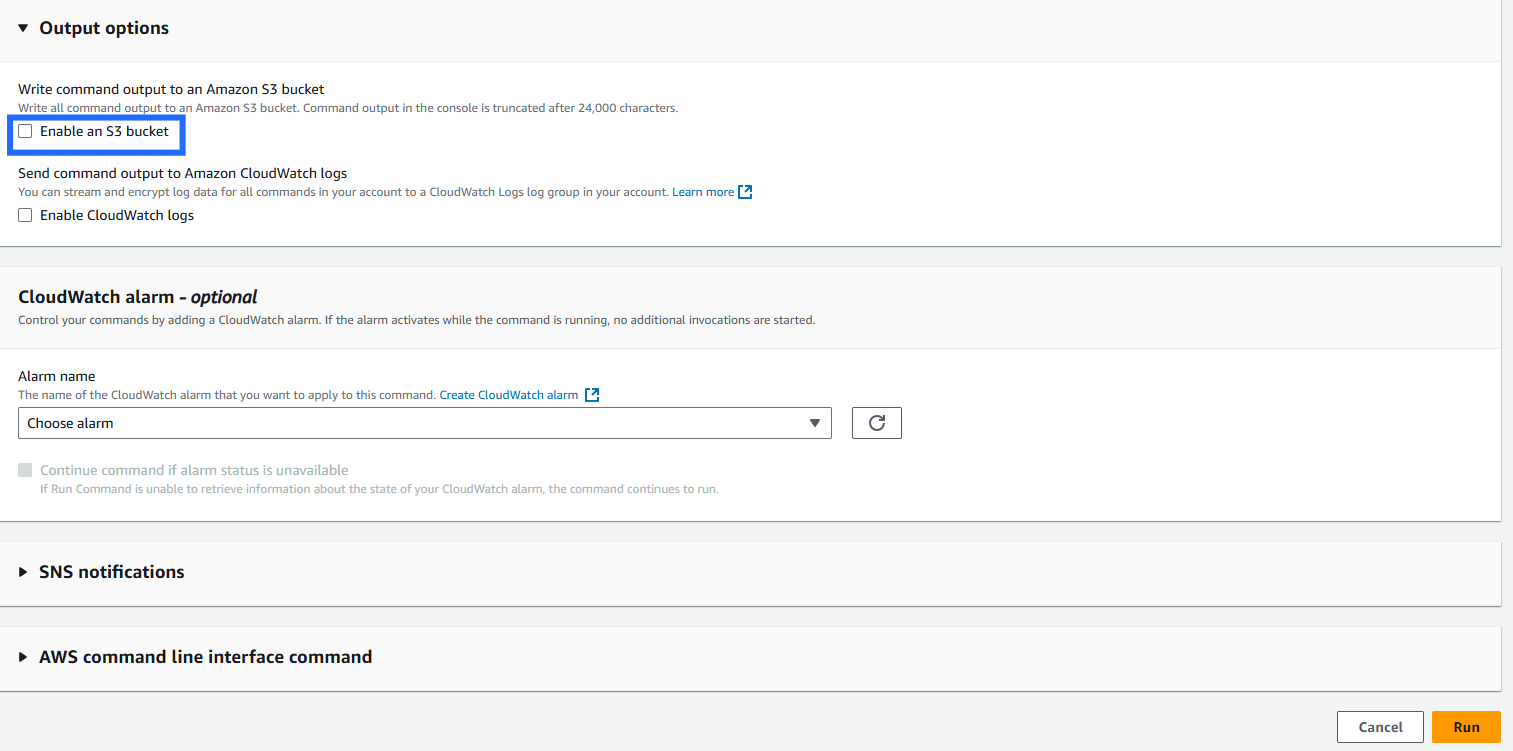
-
Check the status of the run. It should be 'Success'.
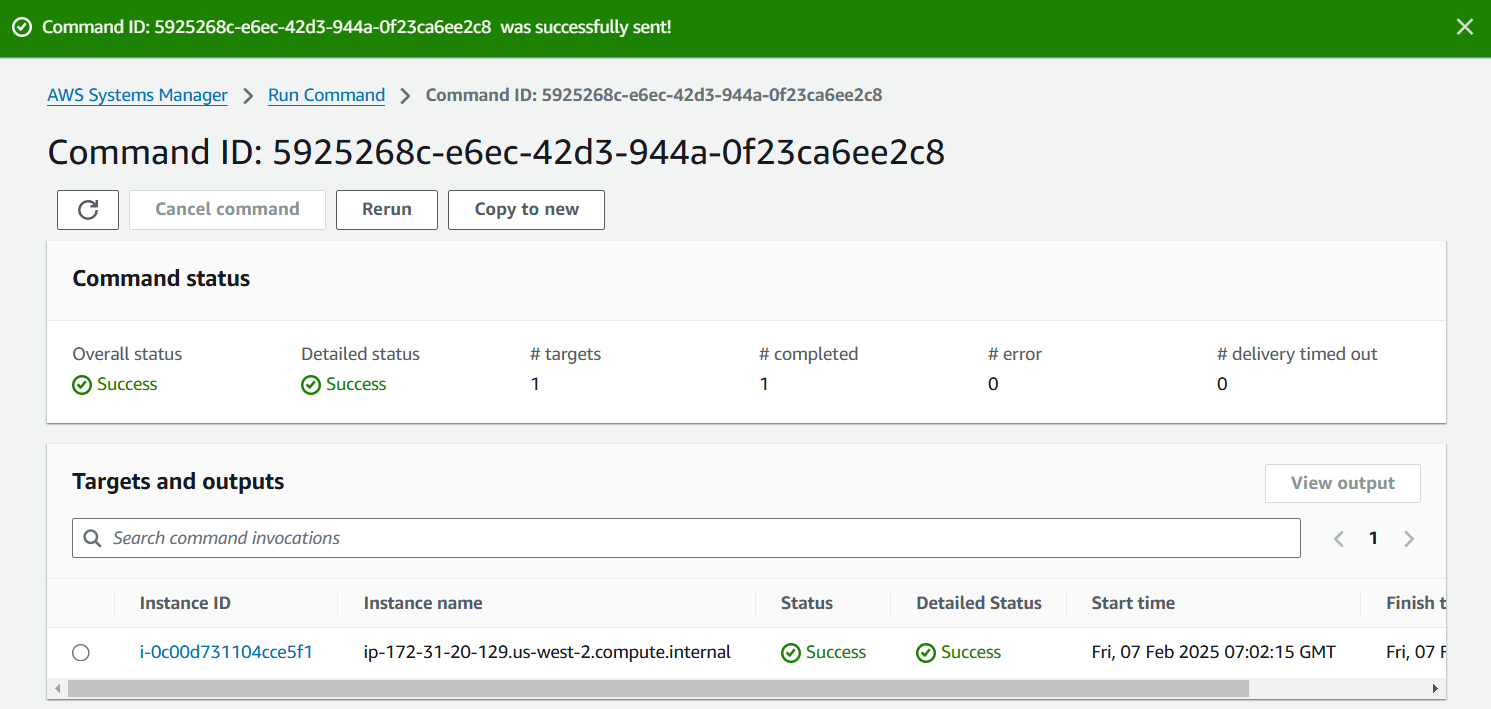
Step 6. To Install Configuration for Monitoring Memory Usage.
CloudWatch Agent can send memory usage information every 60 seconds based on metrics_collection_interval.
-
Go to Systems Manager console -> Run command -> Run a command.
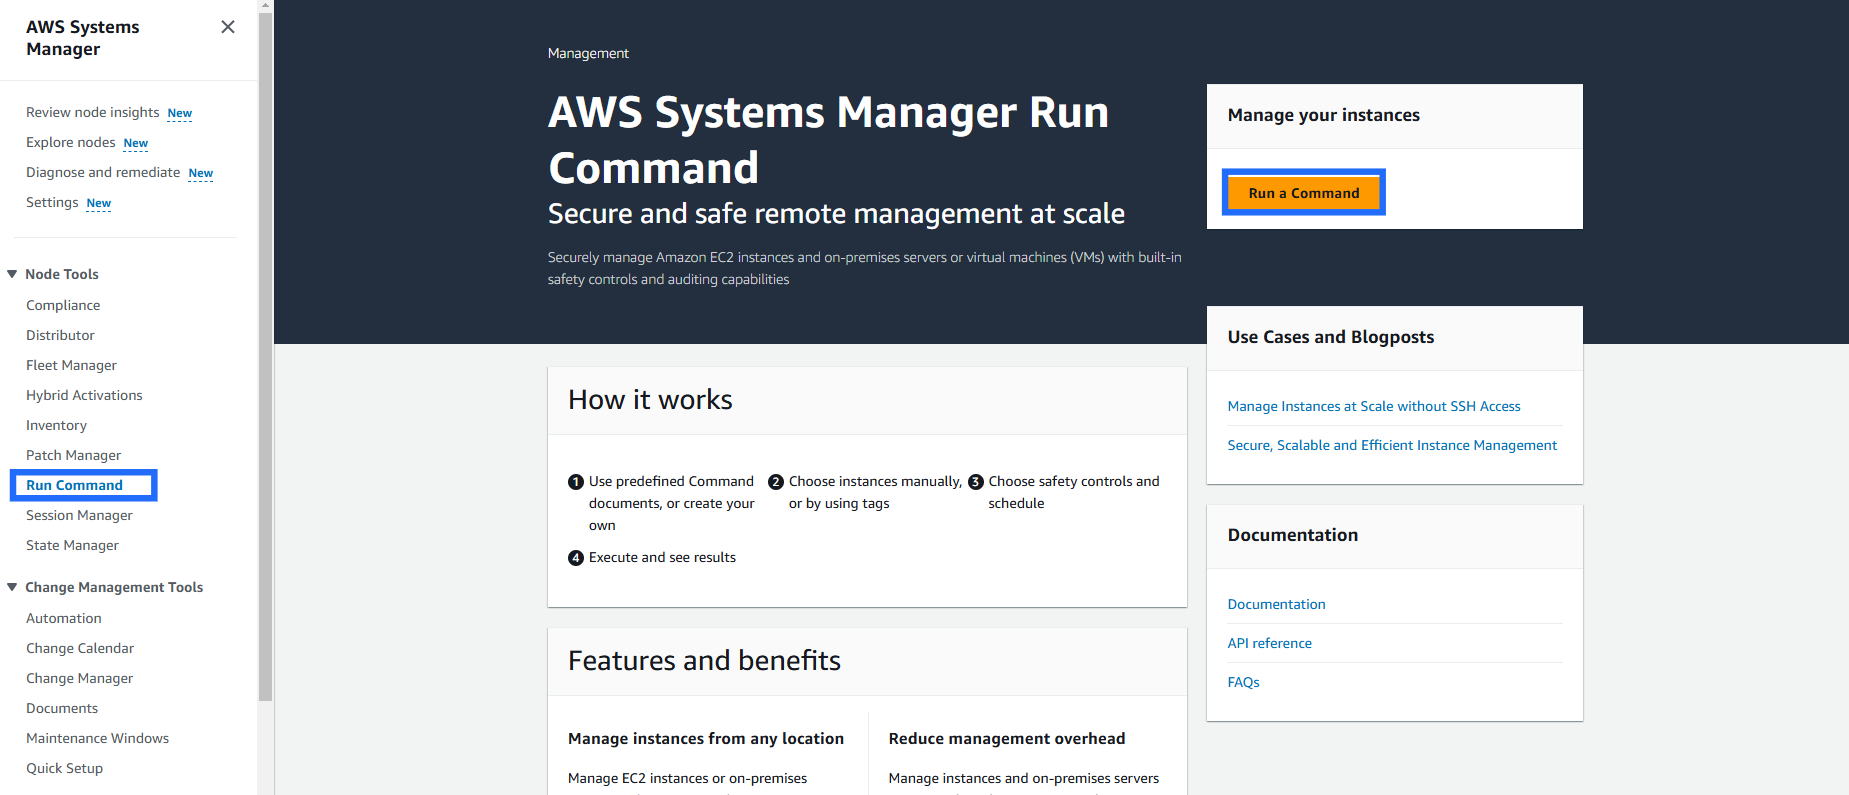
-
In Command document Search "AmazonCloudWatch-ManageAgent" from the command list and select.
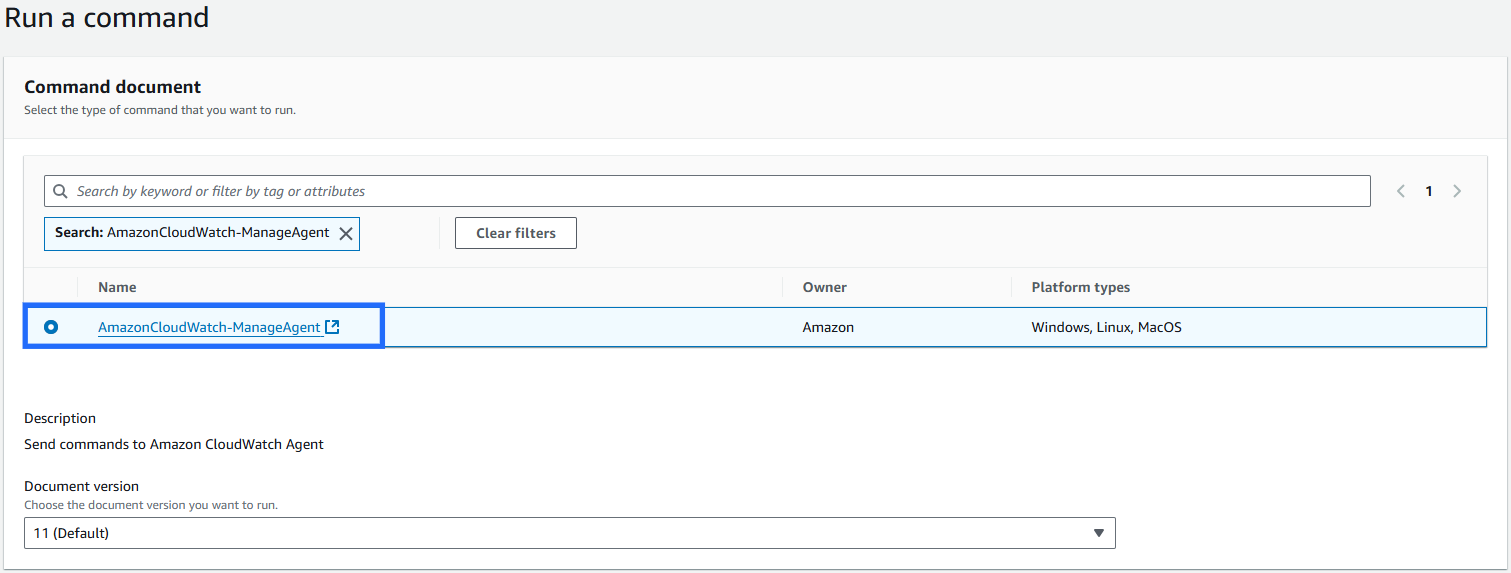
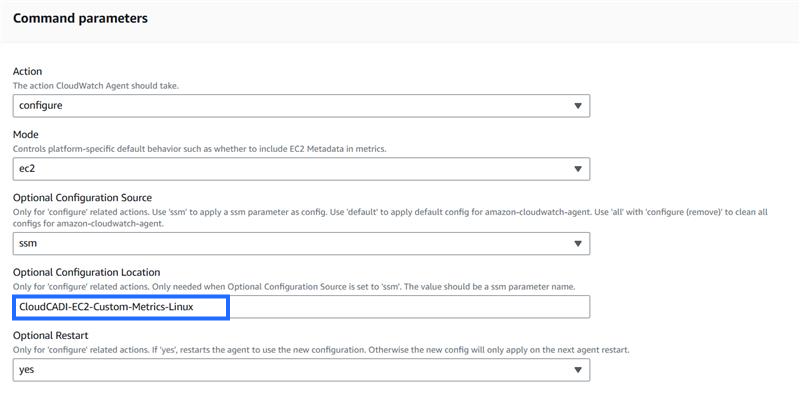
Command paramters
-
Optional Configuration Location: CloudCADI-EC2-Custom-Metrics-Linux (Get the parameter name which was created earlier).

Target selection
-
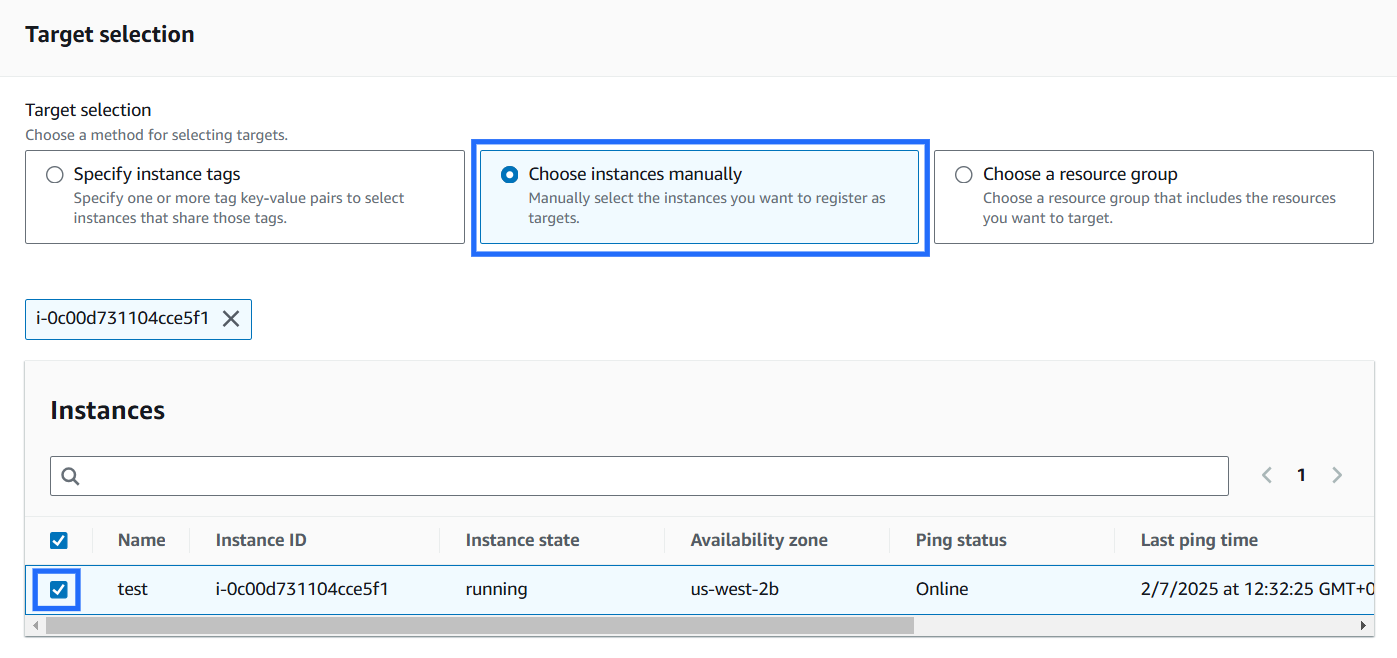
Target selection: Choose instances manually.
-
Select the instances where the AmazonCloudWatchAgent to be installed.
Output options
-
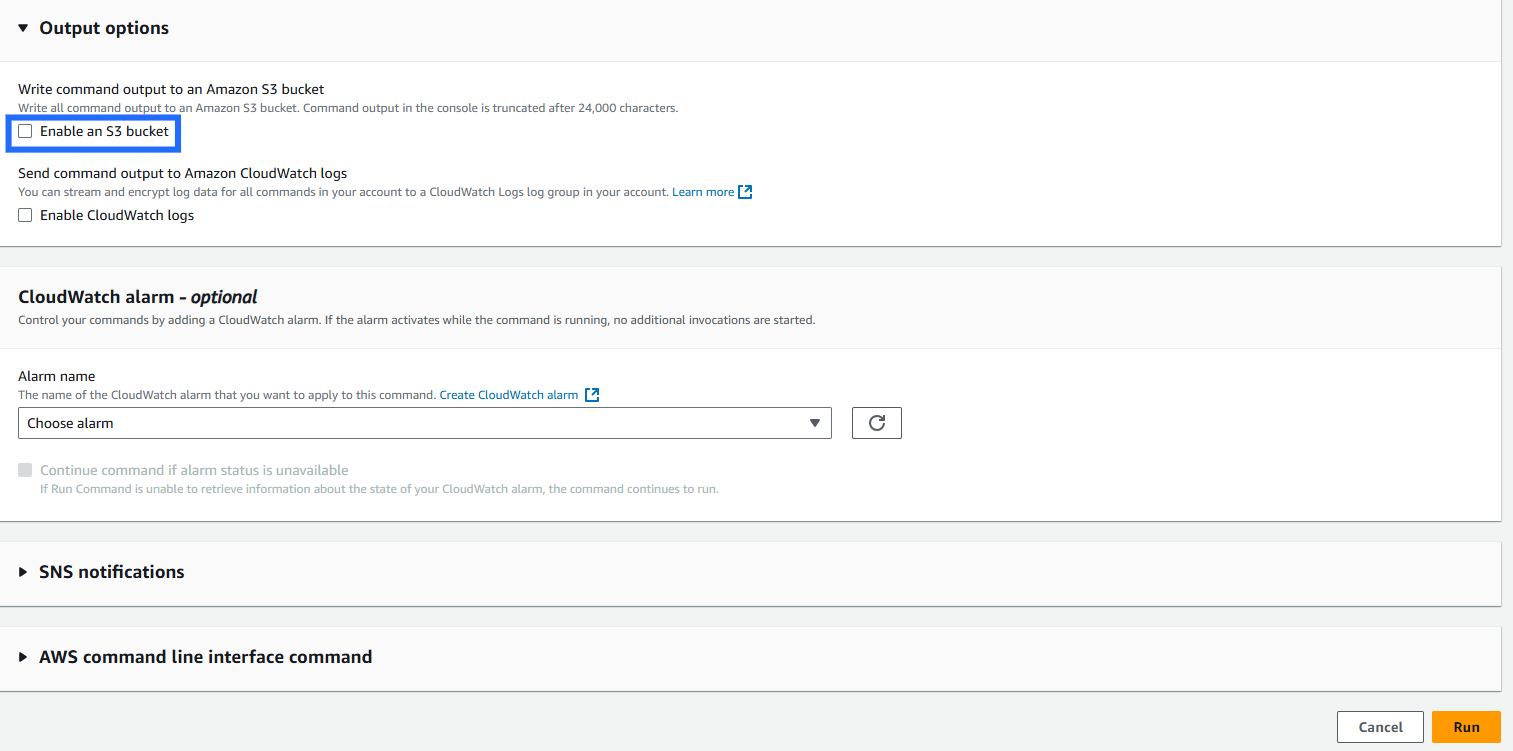
Specify the S3 bucket if the command output to be stored if not disable and click Run.
-
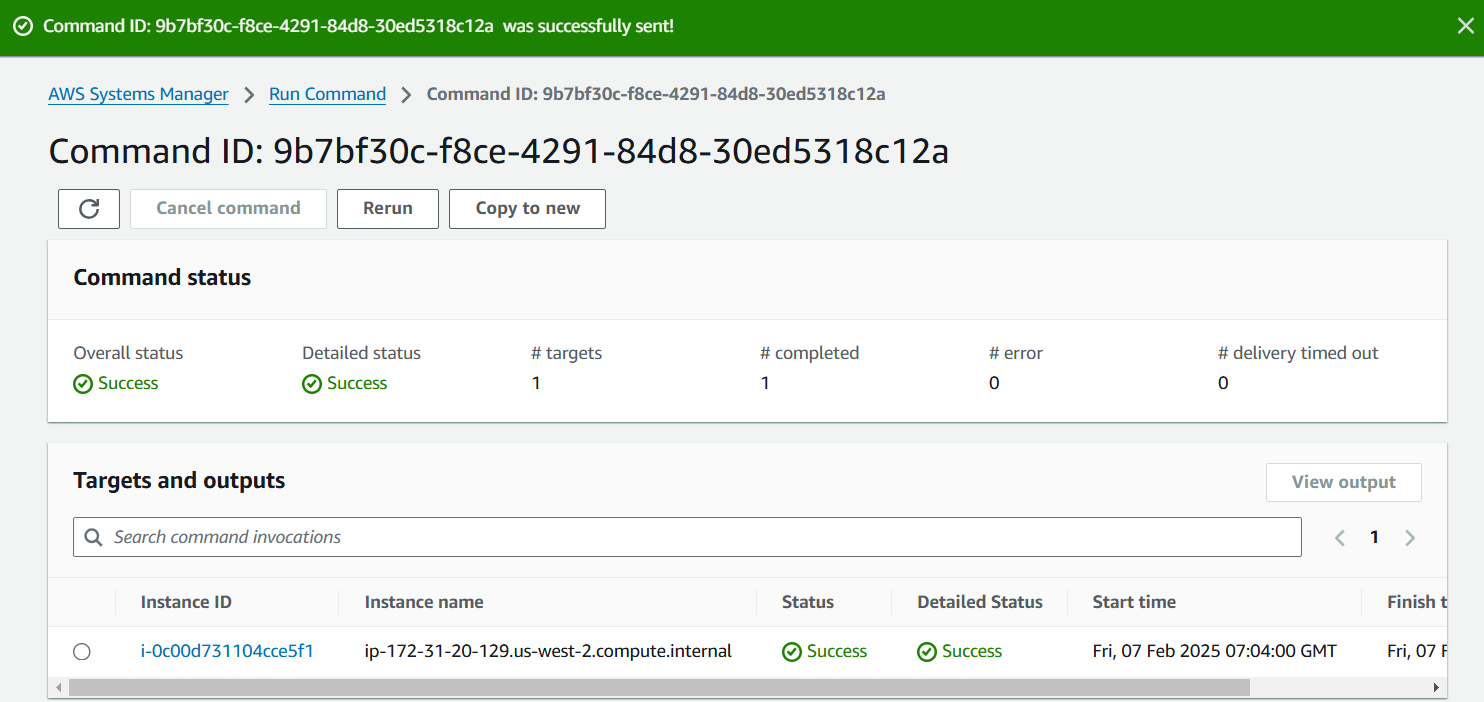
Check the status of the run. It should be 'Success'.
Follow the above steps from (4.1.3 – 4.1.6) to enable custom memory metrics for EC2 for the desired regions.
Step 7. Check CloudWatch Console
- Go to CloudWatch console -> All metrics.
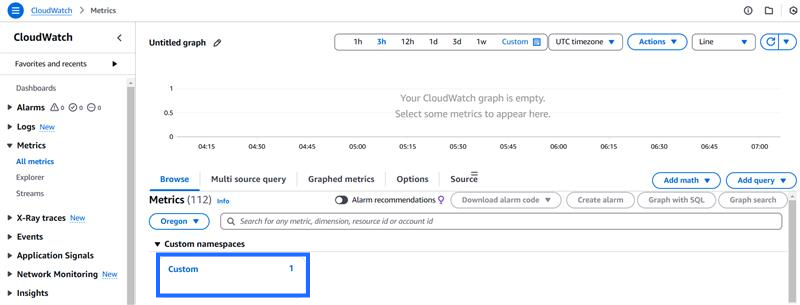
- If everything done correctly then there should be a new Custom namespace in the CloudWatch all metrics and click on Custom.
-
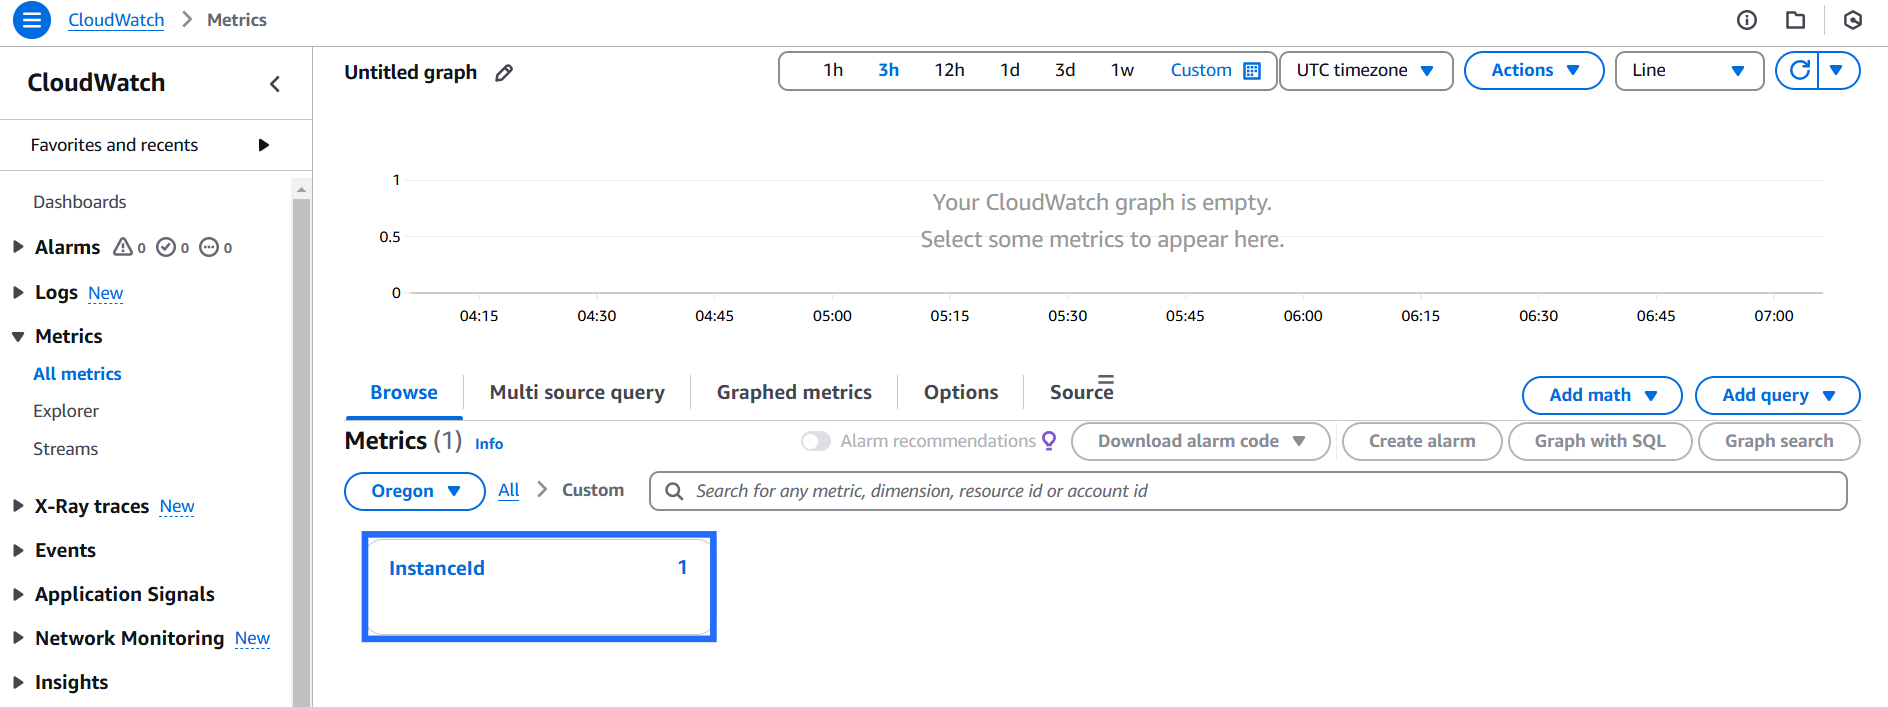
Click on InstanceId.
-
Select Instance to see the metrics of memory usage.
ECS
Step 1 - Enable Container Insights
CloudWatch automatically collects metrics for many resources, such as CPU, memory, disk, and network. Container Insights also provides diagnostic information, such as container restart failures, that you use to isolate issues and resolve them quickly.
-
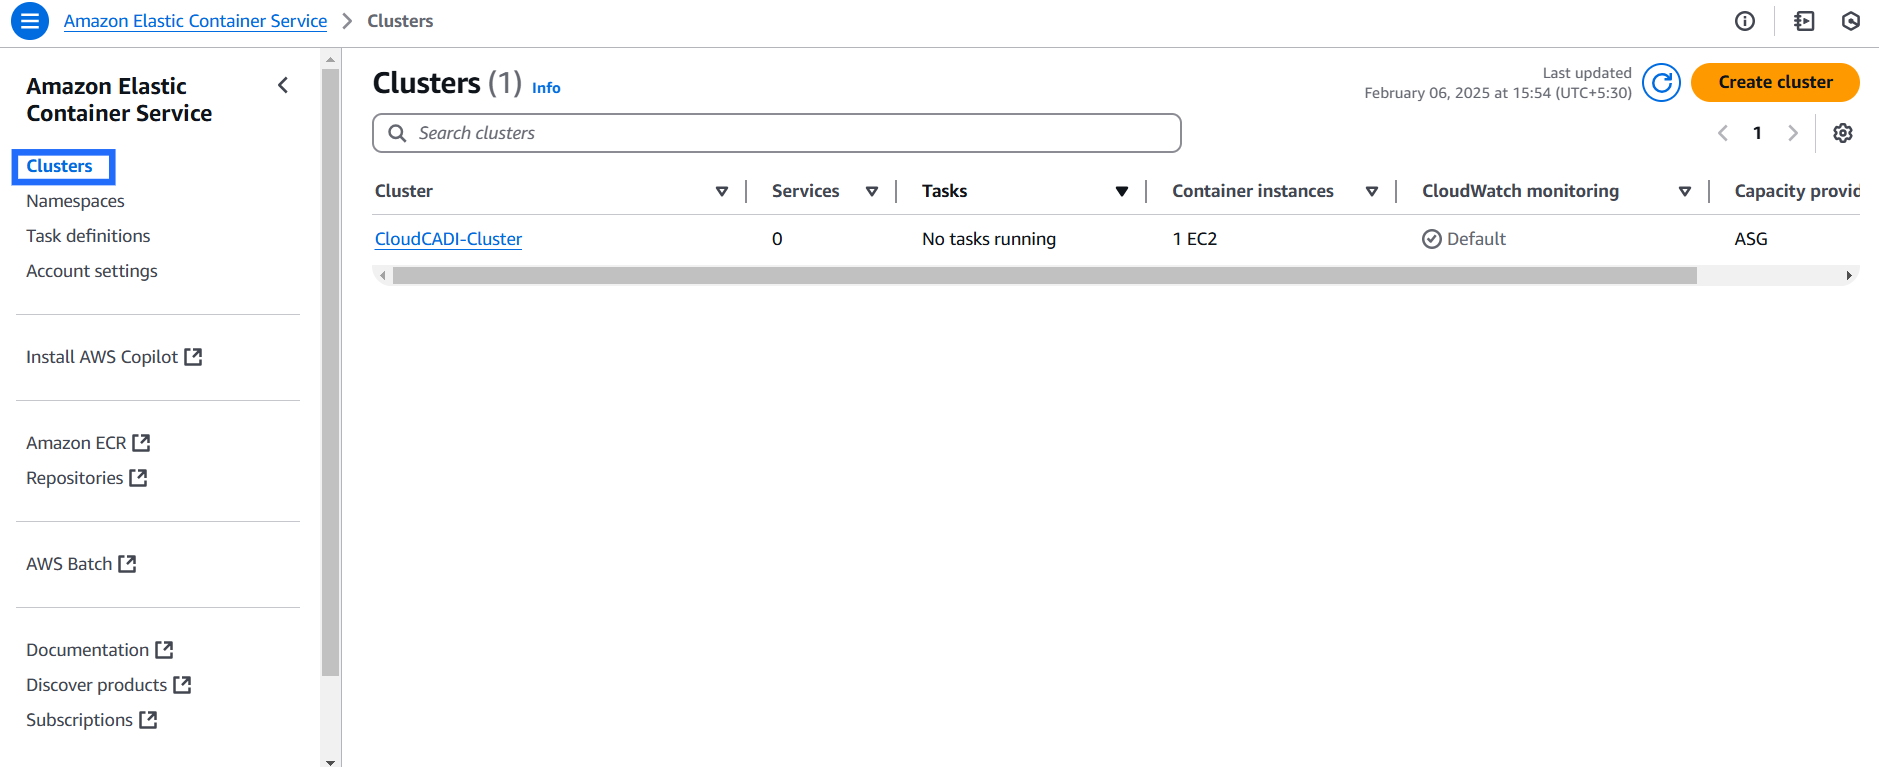
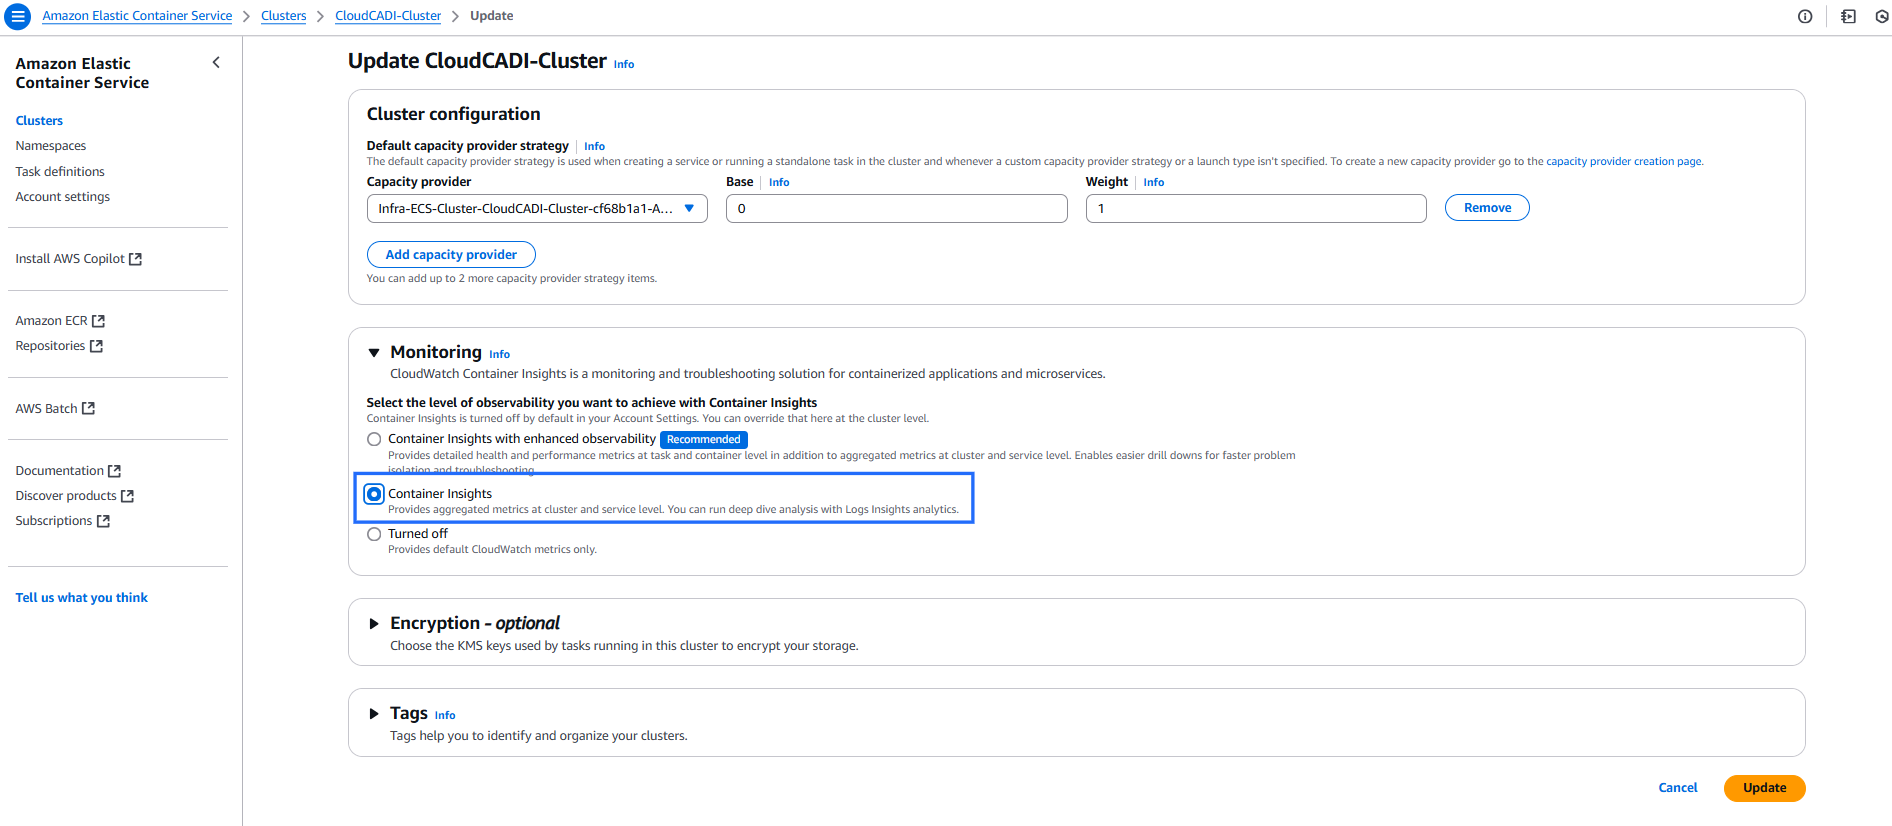
Go to ECS console -> Clusters.
-
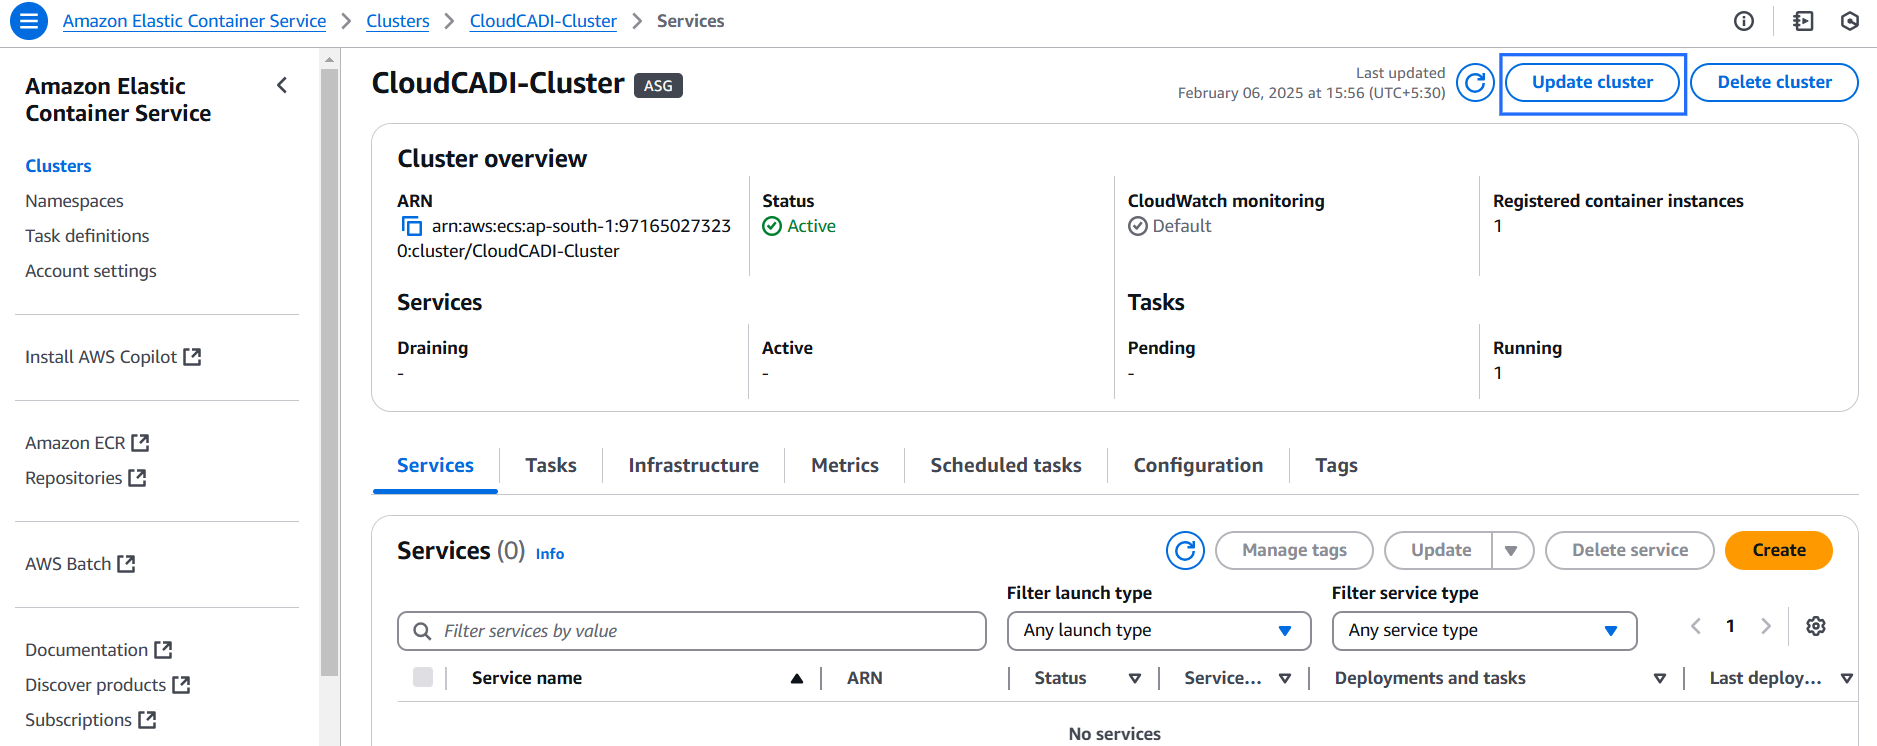
Choose the cluster name and click Update cluster.
-
Under Update test-cluster -> Monitoring: Enable Use Container Insights.
-
Click Update.
Step 2 - Check CloudWatch Console
-
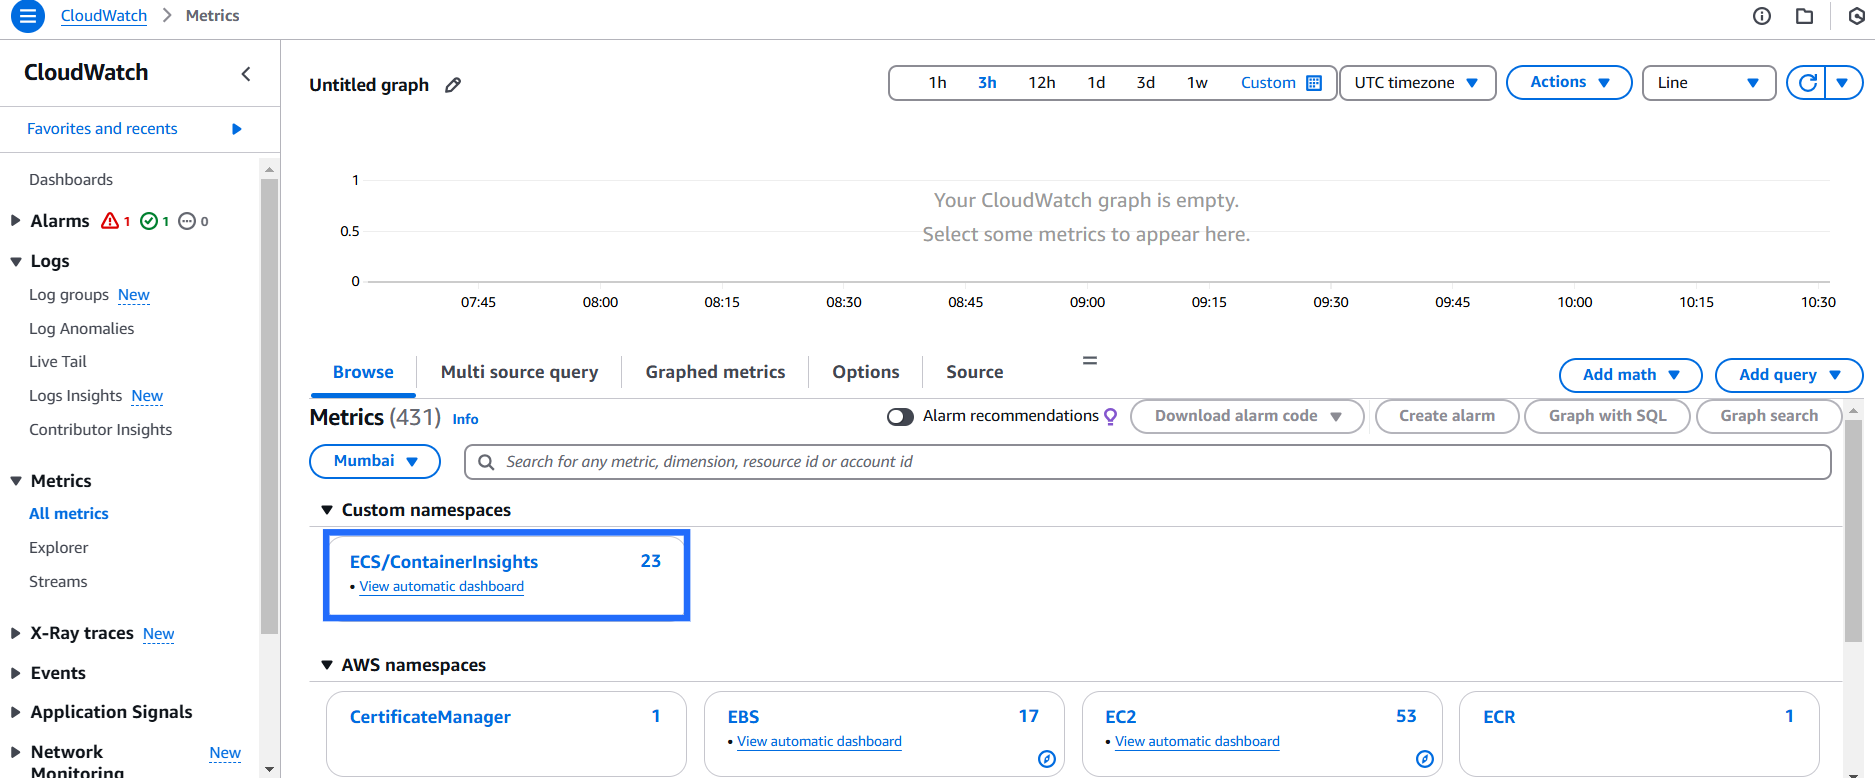
Go to CloudWatch console -> All metrics.
-
There should be a new Custom namespace in the CloudWatch all metrics and click on ECS/ContainerInsights.
-
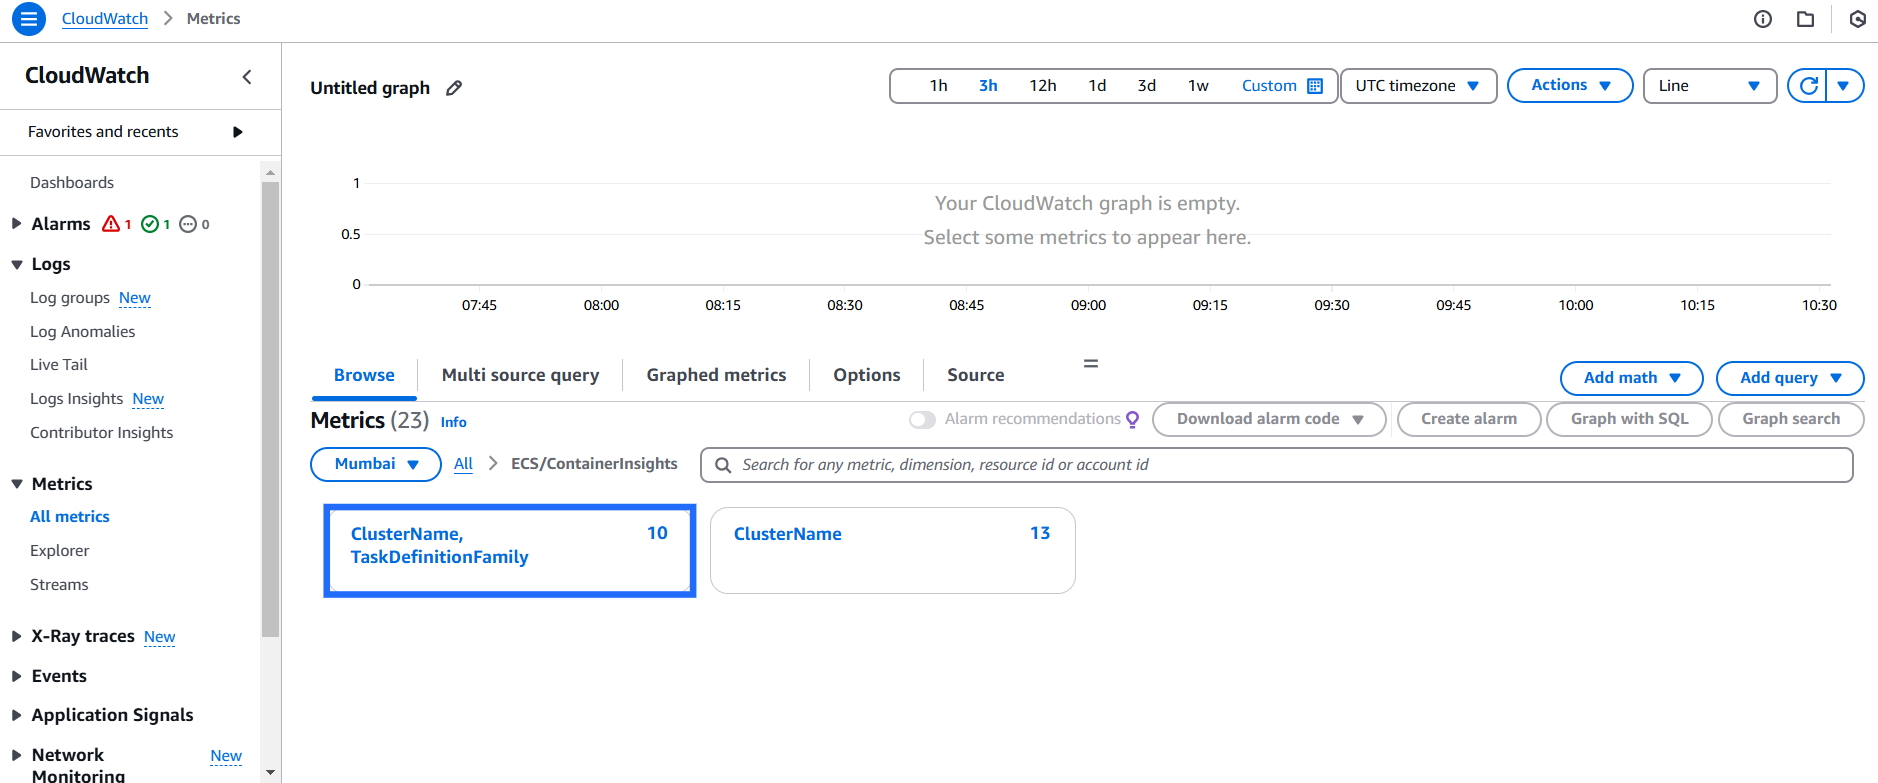
Click on ClusterName, TaskDefinitionFamily.
-
Select cluster to see the metrics.
EKS
Step 1 - Enable Container Insights to Get Performance Details
The metrics that Container Insights collects are available in CloudWatch automatic dashboards. You can analyse and troubleshoot container performance and log data with CloudWatch Logs Insights.
-
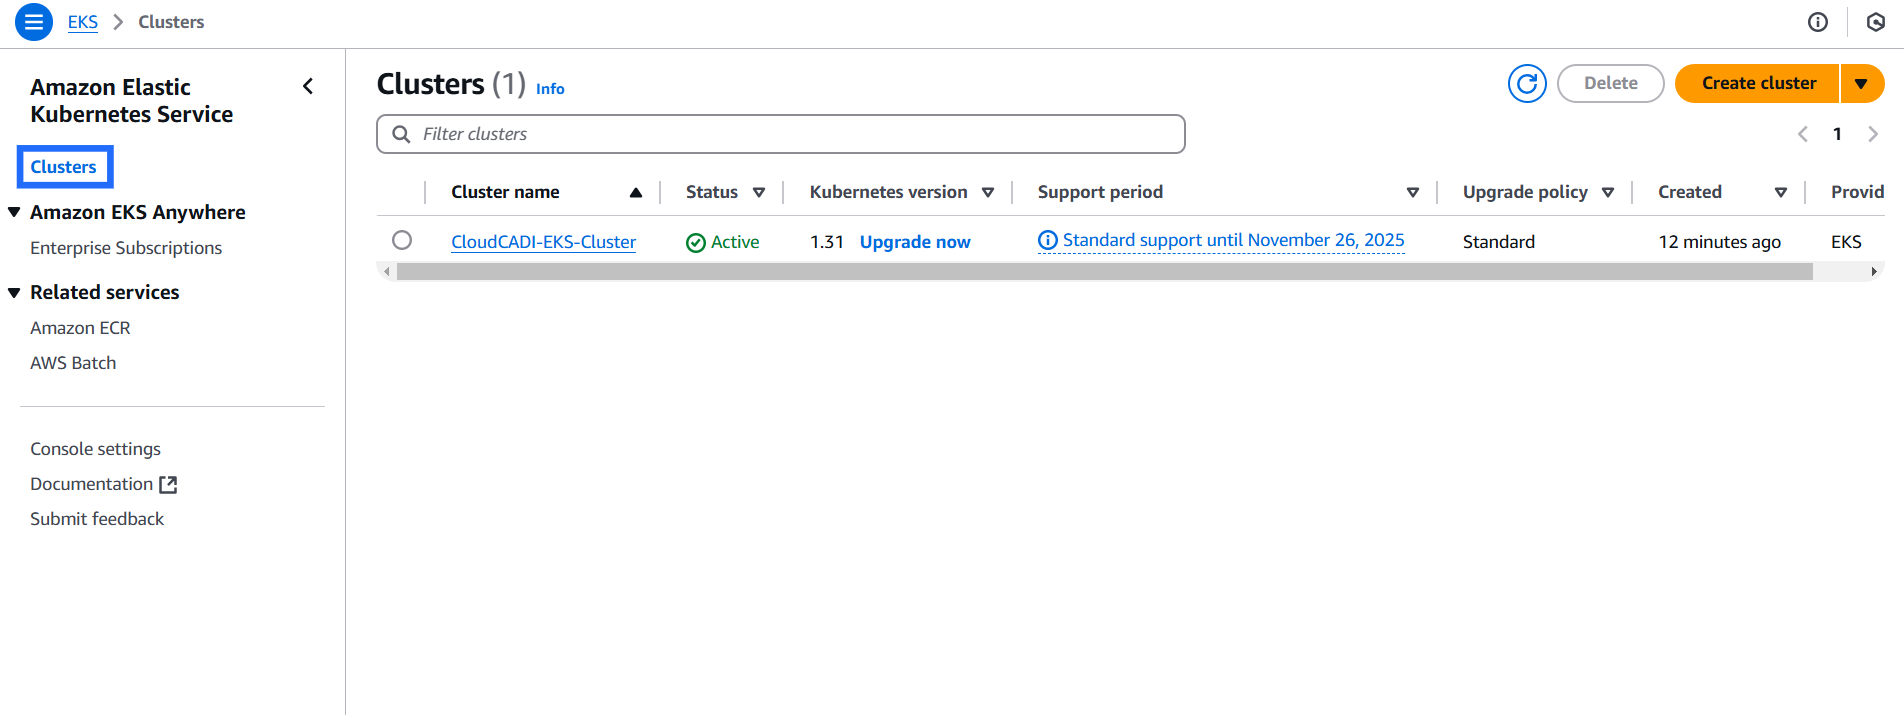
Go to EKS console -> Clusters.
-
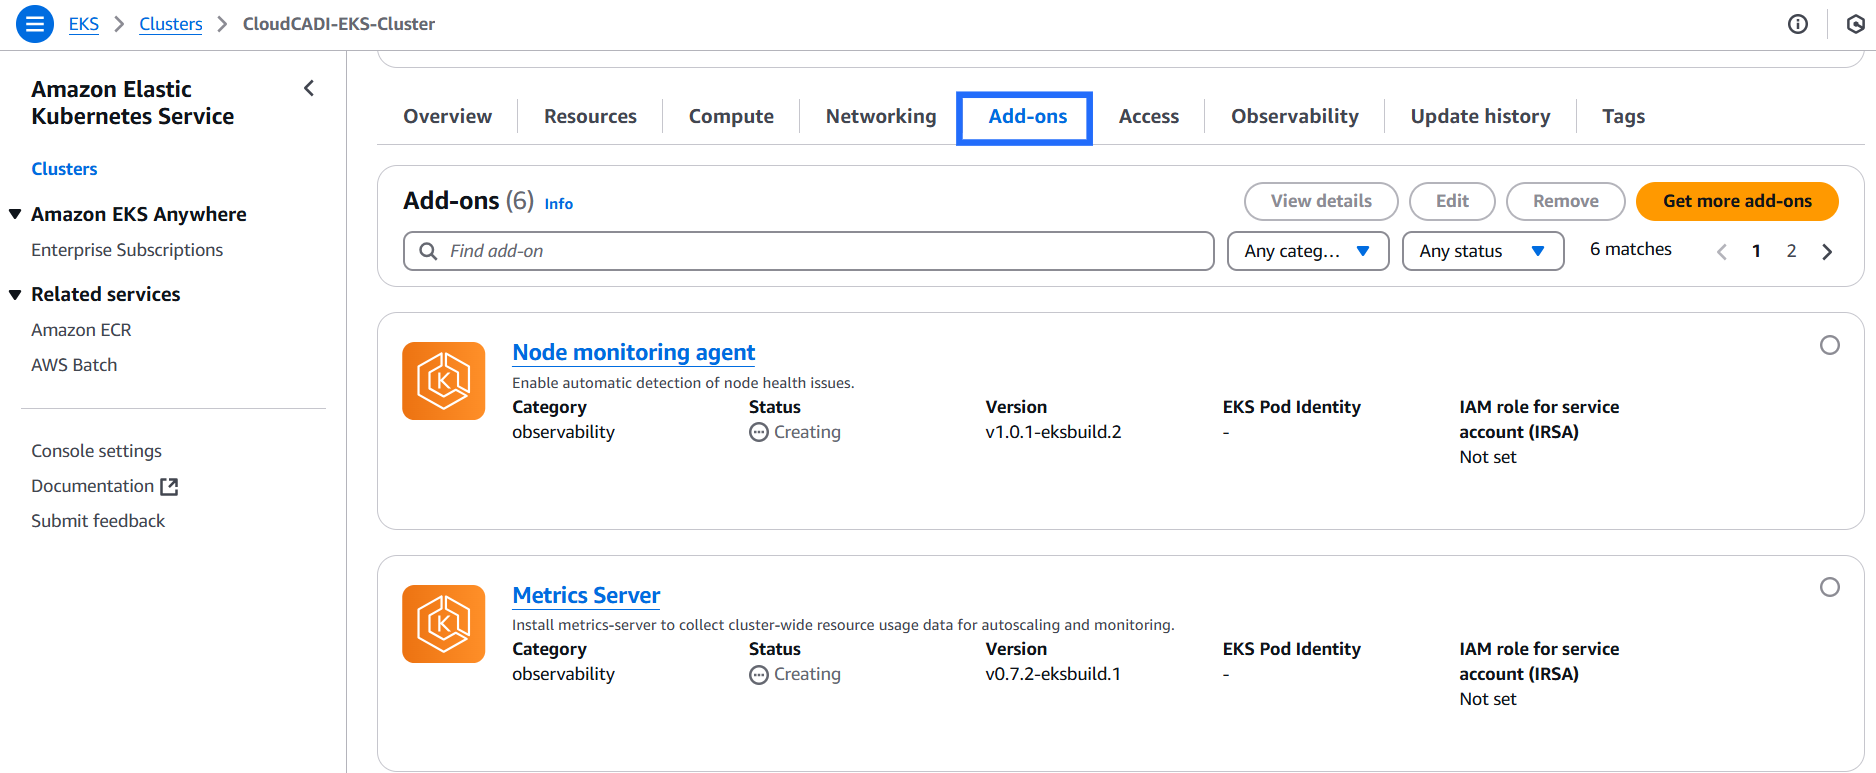
Click the cluster name and go to Add-ons tab -> Get more add-ons.
-
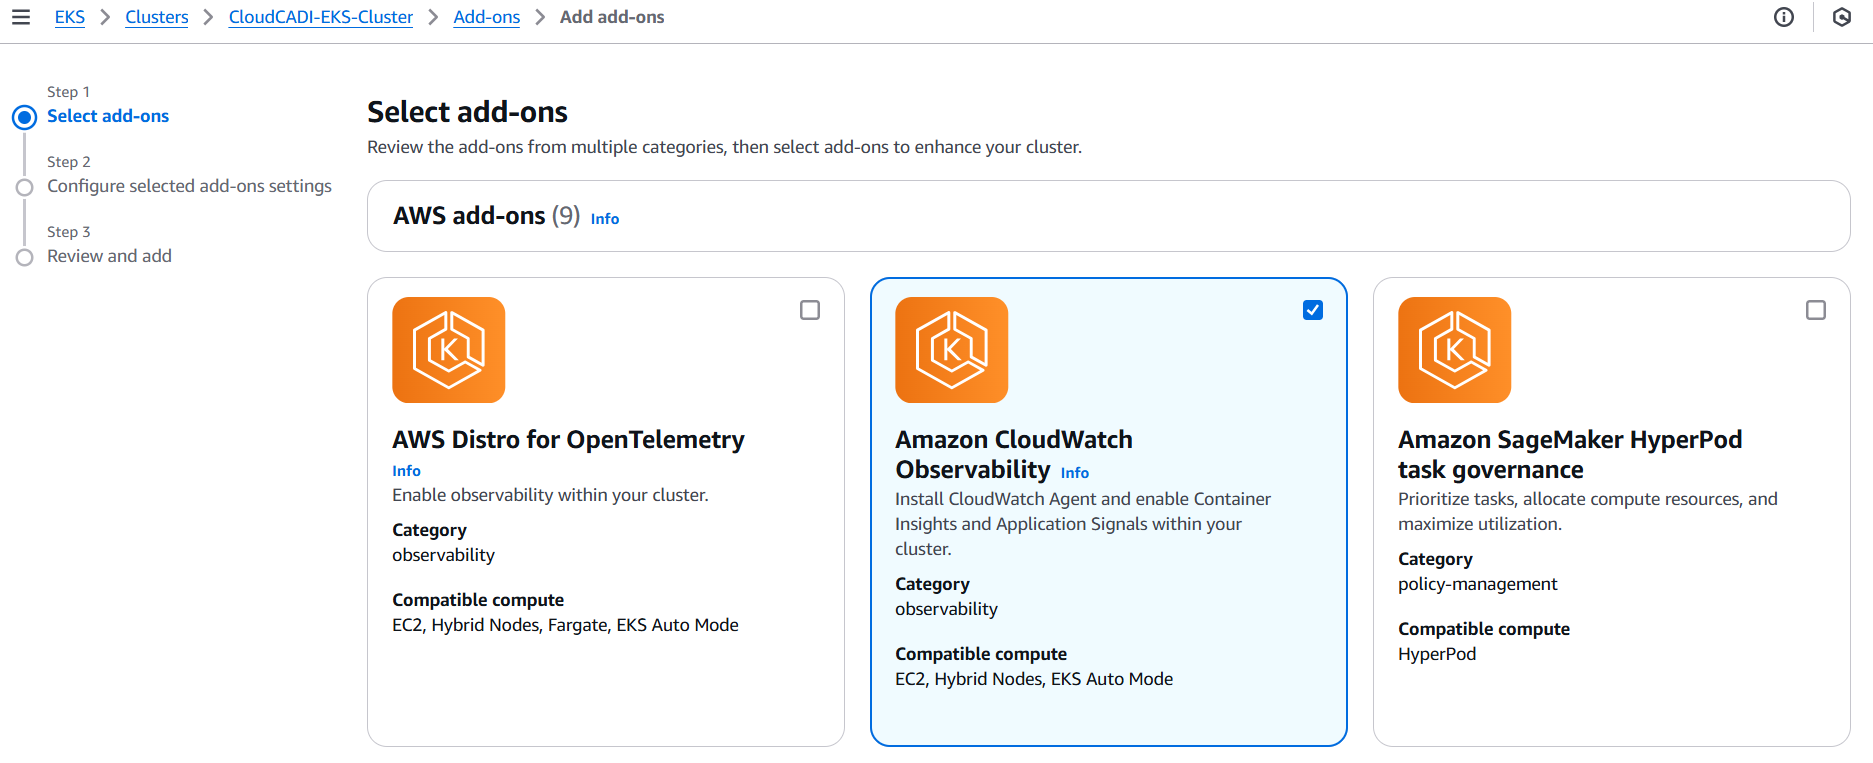
Choose Amazon CloudWatch Observability and click Next.
-
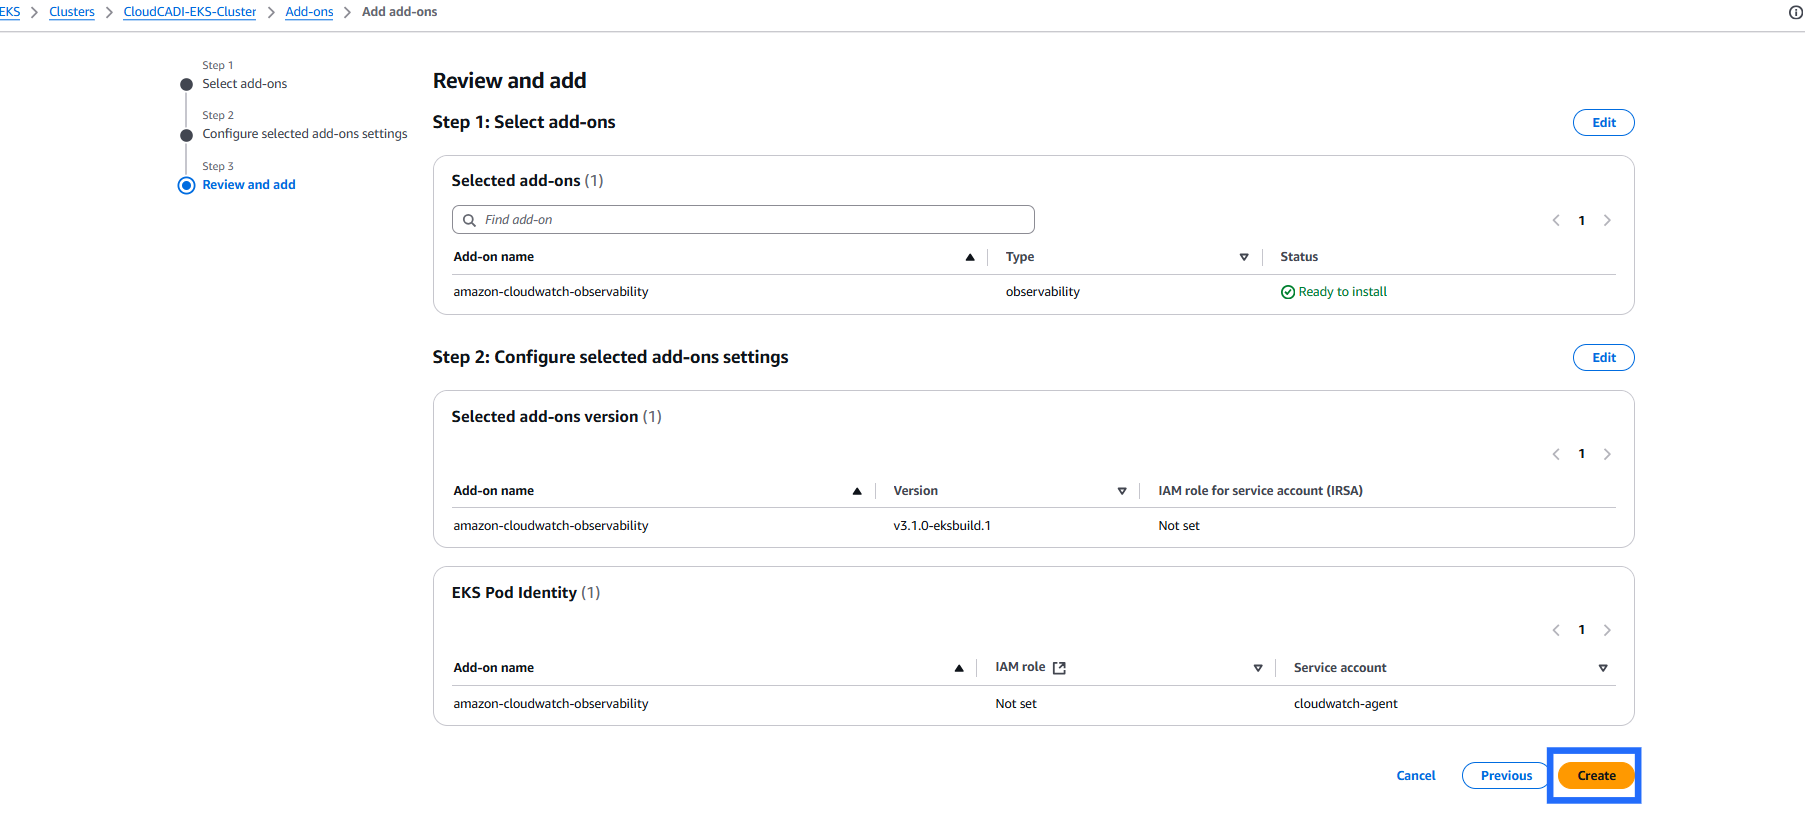
Click Create.
Step 2 - Enable Log groups to Get Cluster Details.
-
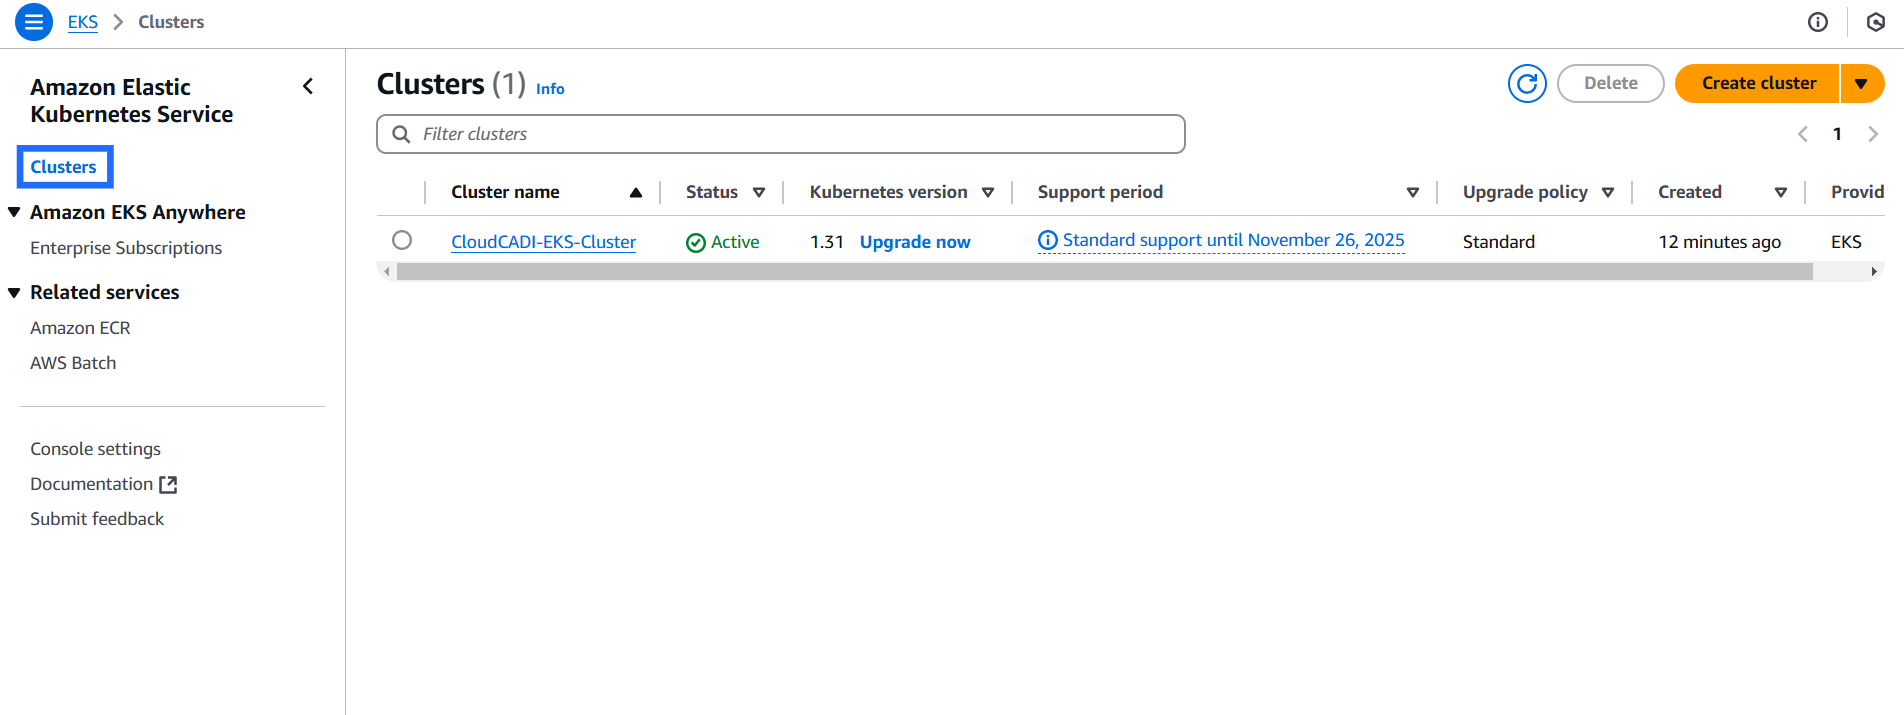
Go to EKS console -> Clusters.
-
Click the cluster name and go to Observability tab.
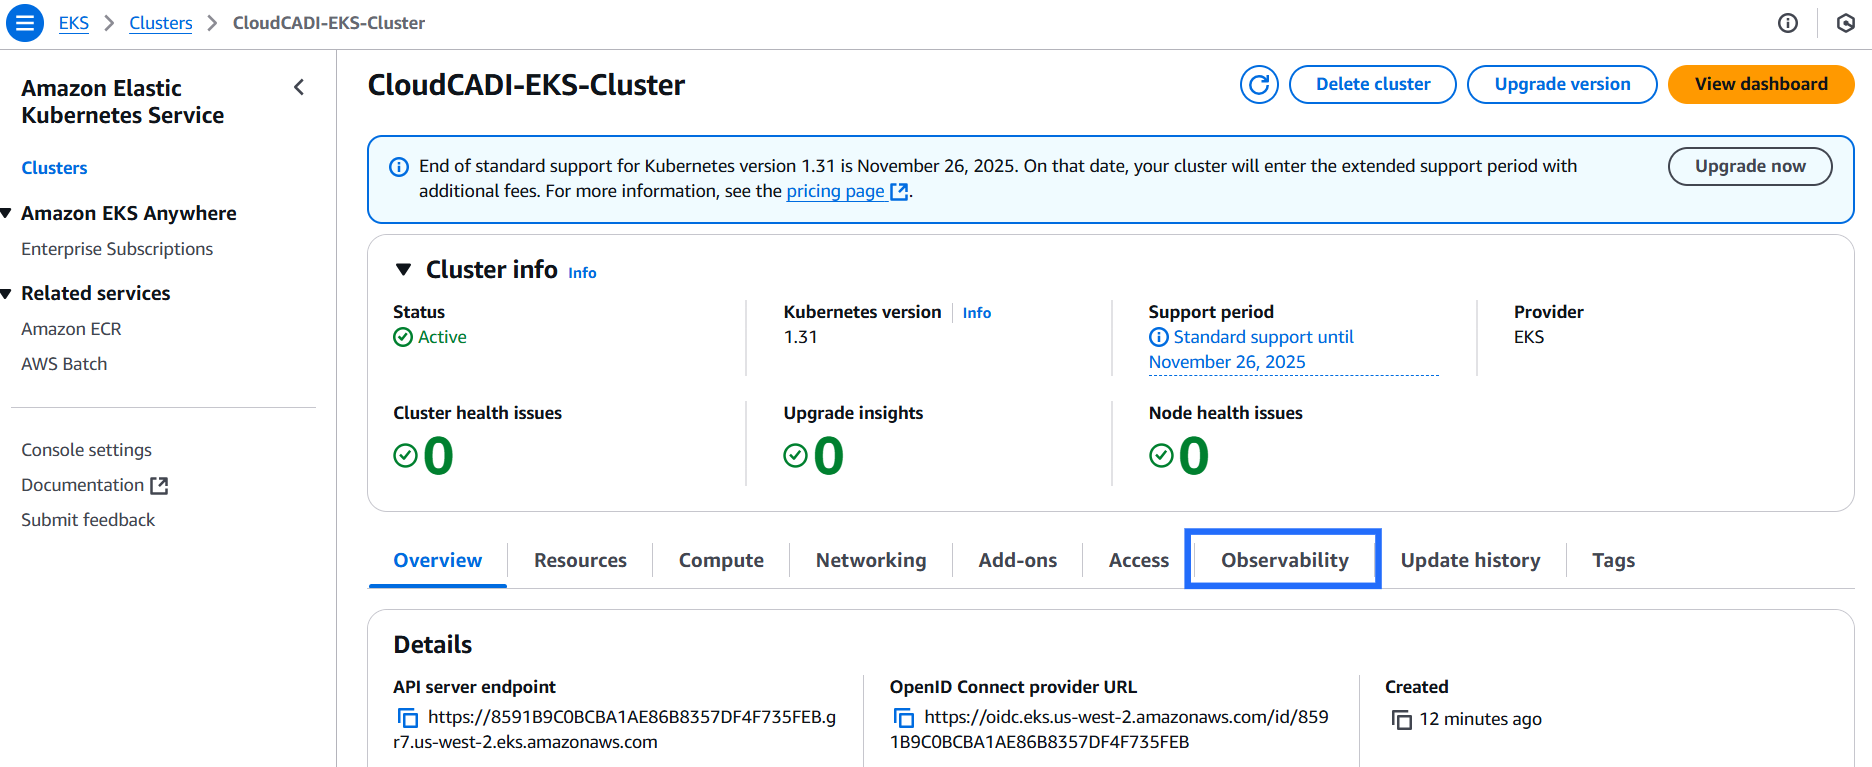
-
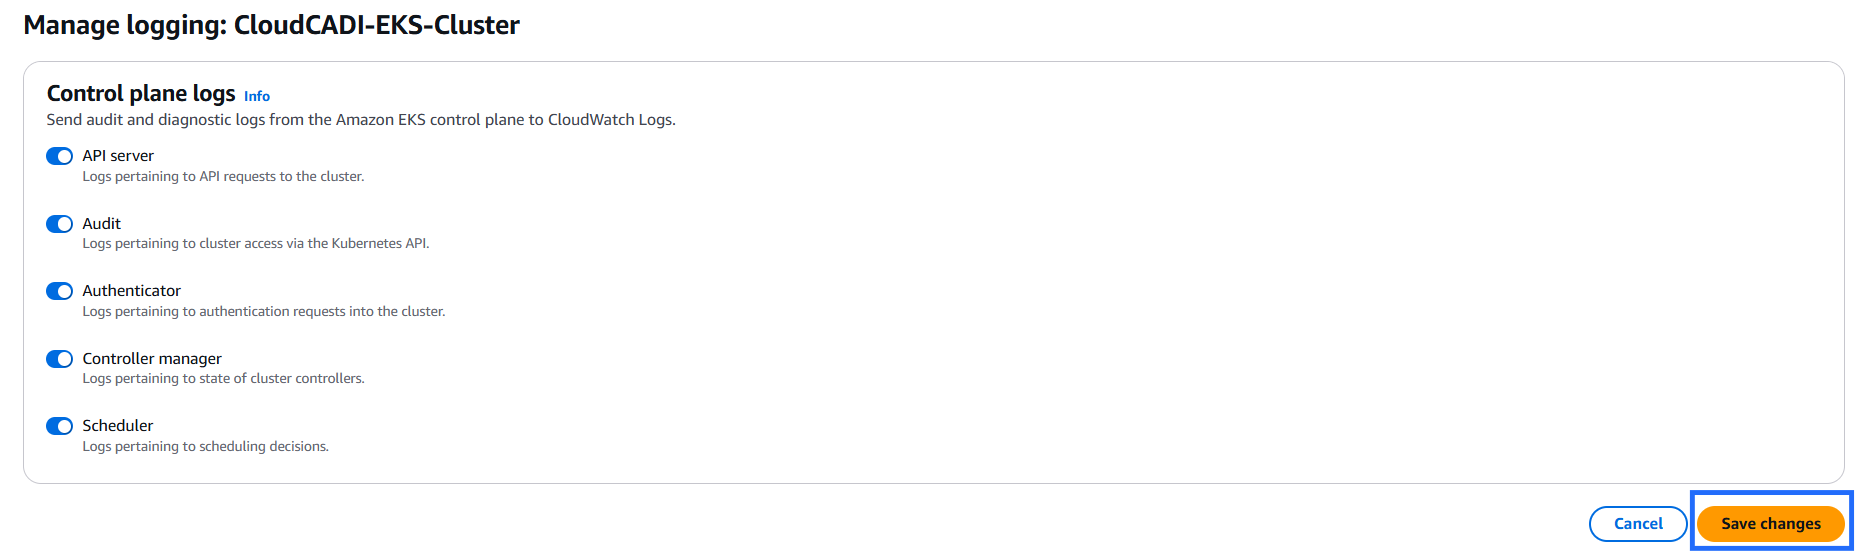
Scroll down and click Control plane logging -> Manage logging.

-
Enable all and click Save changes.
Step 3 - Check CloudWatch Console
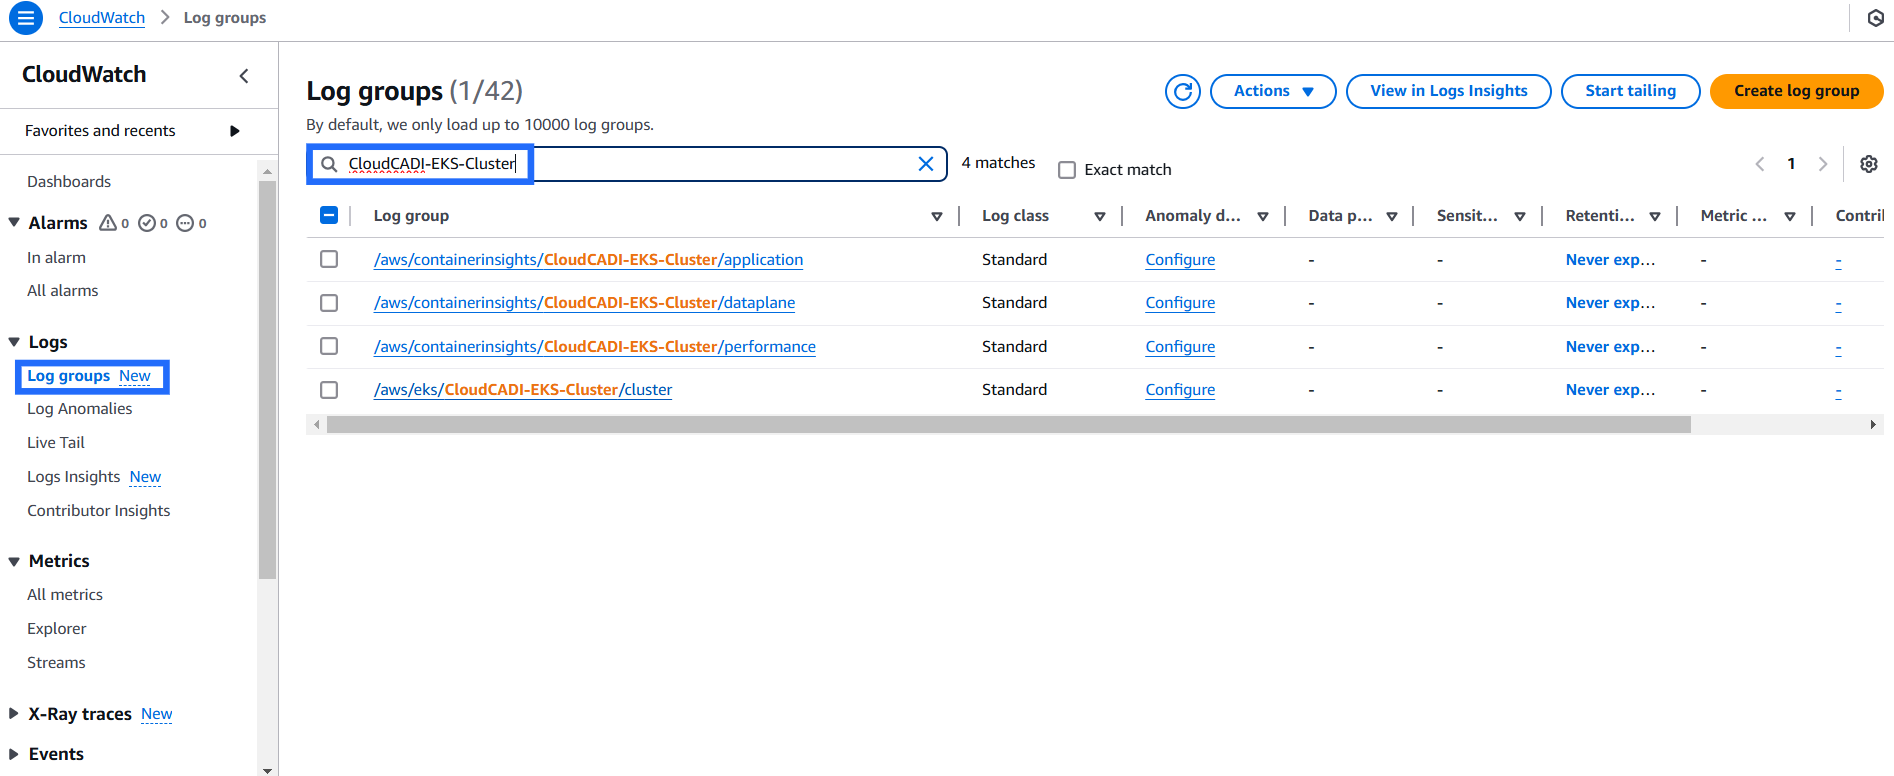
- Go to CloudWatch console -> Logs -> Log groups.
- Search for the cluster name to see the log groups and container insights performance metrics.